|
Orkney & Shetland
Liberal Democrat hold

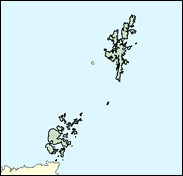
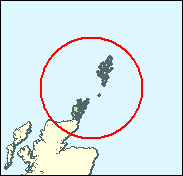
This long-term Liberal stronghold has already been passed on at a general election once, from Jo Grimond to Jim Wallace in 1983, and on the latter's assumption of the important role of Liberal Democrat and junior coalition) leader in the Edinburgh Parliament, the task of holding the northernmost seat falls to Alistair Carmichael. All historical and common-sense arguments suggest that he can and will. This is far and away the Liberal (Democrat) seat with the longest, and safest, continuous representation. In its attitudes it is independent both of the United Kingdom as a whole and even of Scotland. It should not be forgotten that Lerwick, the Shetland capital, is 204 miles north of Aberdeen - and just 234 miles west of Bergen in Norway.

Alistair Carmichael has followed the Scottish "deputy prime minister" Jim Wallace as the Liberal Democrat's candidate for this 50-year long stronghold. A chubby-faced, small-eyed solicitor, born 1965 and educated at Islay High School and Aberdeen University, he will be a veritable shoo-in in this traditional rural, small town and island seat, as an island hill farmer's son, married to a vet and who, as a solicitor and former deputy procurator fiscal, can more than reassure on the law and order flank. He will also benefit from his party's solid occupancy of the constituency's two Holyrood seats.
 |
| Wealthy Achievers, Suburban Areas |
5.25% |
14.99% |
35.00 |
|
| Affluent Greys, Rural Communities |
35.34% |
2.13% |
1,662.23 |
|
| Prosperous Pensioners, Retirement Areas |
0.93% |
2.49% |
37.38 |
|
| Affluent Executives, Family Areas |
5.82% |
4.43% |
131.47 |
|
| Well-Off Workers, Family Areas |
1.39% |
7.27% |
19.15 |
|
| Affluent Urbanites, Town & City Areas |
0.00% |
2.56% |
0.00 |
|
| Prosperous Professionals, Metropolitan Areas |
0.00% |
2.04% |
0.00 |
|
| Better-Off Executives, Inner City Areas |
1.46% |
3.94% |
37.00 |
|
| Comfortable Middle Agers, Mature Home Owning Areas |
16.86% |
13.04% |
129.32 |
|
| Skilled Workers, Home Owning Areas |
6.67% |
12.70% |
52.52 |
|
| New Home Owners, Mature Communities |
7.77% |
8.14% |
95.43 |
|
| White Collar Workers, Better-Off Multi Ethnic Areas |
2.12% |
4.02% |
52.69 |
|
| Older People, Less Prosperous Areas |
3.33% |
3.19% |
104.68 |
|
| Council Estate Residents, Better-Off Homes |
11.52% |
11.31% |
101.82 |
|
| Council Estate Residents, High Unemployment |
0.09% |
3.06% |
2.86 |
|
| Council Estate Residents, Greatest Hardship |
1.45% |
2.52% |
57.47 |
|
| People in Multi-Ethnic, Low-Income Areas |
0.00% |
2.10% |
0.00 |
|
| Unclassified |
0.00% |
0.06% |
0.00 |
|
|
 |
 |
 |
| £0-5K |
8.71% |
9.41% |
92.56 |
|
| £5-10K |
16.94% |
16.63% |
101.87 |
|
| £10-15K |
17.59% |
16.58% |
106.12 |
|
| £15-20K |
14.60% |
13.58% |
107.51 |
|
| £20-25K |
11.12% |
10.39% |
106.95 |
|
| £25-30K |
8.17% |
7.77% |
105.10 |
|
| £30-35K |
5.93% |
5.79% |
102.42 |
|
| £35-40K |
4.30% |
4.33% |
99.27 |
|
| £40-45K |
3.13% |
3.27% |
95.86 |
|
| £45-50K |
2.29% |
2.48% |
92.35 |
|
| £50-55K |
1.69% |
1.90% |
88.86 |
|
| £55-60K |
1.26% |
1.47% |
85.43 |
|
| £60-65K |
0.95% |
1.15% |
82.12 |
|
| £65-70K |
0.72% |
0.91% |
78.95 |
|
| £70-75K |
0.55% |
0.72% |
75.92 |
|
| £75-80K |
0.42% |
0.57% |
73.05 |
|
| £80-85K |
0.33% |
0.46% |
70.33 |
|
| £85-90K |
0.25% |
0.37% |
67.75 |
|
| £90-95K |
0.20% |
0.31% |
65.32 |
|
| £95-100K |
0.16% |
0.25% |
63.02 |
|
| £100K + |
0.69% |
1.34% |
51.20 |
|
|
|

|


|
1992-1997
|
1997-2001
|
|
|
|
| Con |
-9.77% |
| Lab |
-1.53% |
| LD |
5.59% |
| SNP |
1.50% |
|
| Con |
6.42% |
| Lab |
2.31% |
| LD |
-10.64% |
| SNP |
2.08% |
|
|
 |
Alistair Carmichael
Liberal Democrat hold
|
| Con |
 |
3,121 |
18.65% |
| Lab |
 |
3,444 |
20.58% |
| LD |
 |
6,919 |
41.35% |
| SNP |
 |
2,473 |
14.78% |
| Oth |
 |
776 |
4.64% |
| Maj |
 |
3,475 |
20.77% |
| Turn |
 |
16,733 |
52.44% |
|
|
 |
Alistair Carmichael
Liberal Democrat hold
|
| SSP |
Peter Andrews |
776 |
4.64% |
| LD |
Alistair Carmichael |
6,919 |
41.35% |
| C |
John Firth |
3,121 |
18.65% |
| SNP |
John Mowat |
2,473 |
14.78% |
| L |
Jim Wallace |
3,444 |
20.58% |
|
Candidates representing 5 parties stood for election to this seat.
|
|
 |
Jim Wallace
Liberal Democrat
|
| Con |
 |
2,527 |
12.23% |
| Lab |
 |
3,775 |
18.27% |
| LD |
 |
10,743 |
51.99% |
| SNP |
 |
2,624 |
12.70% |
| Ref |
 |
820 |
3.97% |
| Oth |
 |
176 |
0.85% |
| Maj |
 |
6,968 |
33.72% |
| Turn |
 |
20,665 |
64.00% |
|
|
 |
|
Liberal Democrat
|
| Con |
 |
4,542 |
22.00% |
| Lab |
 |
4,093 |
19.80% |
| LD |
 |
9,575 |
46.40% |
| SNP |
 |
2,301 |
11.20% |
| Oth |
 |
115 |
0.60% |
| Maj |
 |
5,033 |
24.40% |
| Turn |
 |
20,626 |
64.79% |
|
|
 |
|

|

