|
Oxford East
Labour hold

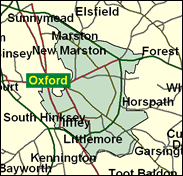
This is the "other" Oxford, across the rivers Cherwell and Thames from the university and the heart of the city and affluent intellectual north Oxford. It includes the remains of the motor works at Cowley, once Morris then Leyland then Rover with its various proprietors; and the grim and troubled post-war council estate at Blackbird Leys even beyond the Cowley works; and Oxford's Asian areas in east and St Clement's wards; and the suburb of Headington which has its own High Street, is still the site of Oxford FC, and contains Headington Hill Hall the former home of the late Robert Maxwell, who loomed over the city during his chequered career. Labour's organisation has been excellent here and the Conservatives have been reduced to a a single councillor in the constituency. At local level there is healthy opposition from an unusual soucre, the Green party, which won two wards in May 2000 and polled 18.5pc across the city. They may save their deposit by reaching 5pc of the vote in the next General Election in Oxford East, but Andrew Smith is very safe here for the moment.

Andrew Smith, Chief Secretary to the Treasury, has been MP here since 1987 when his victory was seen as the start of Labour's fight back in the South from which it had virtually been eliminated in 1983. Alleged sufferer from a charisma-bypass and with a much remarked-upon monotonous slowly-articulated turkey-voice, he was born in 1951 and educated at Reading School and St. John's College, Oxford, and worked for the Oxford & Swindon Co-op for eight years before 1987. Previously pilot of the Welfare to Work strategy, as Chief Secretary he mirrors the Chancellor's 'prudence,' and has negotiated the hugely profitable mobile phone strategic partnership.
 |
| Wealthy Achievers, Suburban Areas |
7.10% |
14.99% |
47.34 |
|
| Affluent Greys, Rural Communities |
0.00% |
2.13% |
0.00 |
|
| Prosperous Pensioners, Retirement Areas |
1.18% |
2.49% |
47.43 |
|
| Affluent Executives, Family Areas |
0.73% |
4.43% |
16.52 |
|
| Well-Off Workers, Family Areas |
0.96% |
7.27% |
13.17 |
|
| Affluent Urbanites, Town & City Areas |
5.99% |
2.56% |
233.45 |
|
| Prosperous Professionals, Metropolitan Areas |
2.06% |
2.04% |
100.85 |
|
| Better-Off Executives, Inner City Areas |
14.93% |
3.94% |
378.54 |
|
| Comfortable Middle Agers, Mature Home Owning Areas |
17.32% |
13.04% |
132.82 |
|
| Skilled Workers, Home Owning Areas |
5.16% |
12.70% |
40.63 |
|
| New Home Owners, Mature Communities |
11.29% |
8.14% |
138.60 |
|
| White Collar Workers, Better-Off Multi Ethnic Areas |
6.51% |
4.02% |
161.87 |
|
| Older People, Less Prosperous Areas |
3.36% |
3.19% |
105.36 |
|
| Council Estate Residents, Better-Off Homes |
16.78% |
11.31% |
148.33 |
|
| Council Estate Residents, High Unemployment |
3.12% |
3.06% |
101.92 |
|
| Council Estate Residents, Greatest Hardship |
2.47% |
2.52% |
98.06 |
|
| People in Multi-Ethnic, Low-Income Areas |
0.64% |
2.10% |
30.53 |
|
| Unclassified |
0.42% |
0.06% |
671.16 |
|
|
 |
 |
 |
| £0-5K |
9.36% |
9.41% |
99.41 |
|
| £5-10K |
16.64% |
16.63% |
100.06 |
|
| £10-15K |
16.89% |
16.58% |
101.90 |
|
| £15-20K |
13.93% |
13.58% |
102.55 |
|
| £20-25K |
10.63% |
10.39% |
102.26 |
|
| £25-30K |
7.89% |
7.77% |
101.44 |
|
| £30-35K |
5.81% |
5.79% |
100.35 |
|
| £35-40K |
4.30% |
4.33% |
99.16 |
|
| £40-45K |
3.20% |
3.27% |
97.97 |
|
| £45-50K |
2.40% |
2.48% |
96.83 |
|
| £50-55K |
1.82% |
1.90% |
95.78 |
|
| £55-60K |
1.40% |
1.47% |
94.84 |
|
| £60-65K |
1.08% |
1.15% |
94.00 |
|
| £65-70K |
0.85% |
0.91% |
93.27 |
|
| £70-75K |
0.67% |
0.72% |
92.65 |
|
| £75-80K |
0.53% |
0.57% |
92.12 |
|
| £80-85K |
0.42% |
0.46% |
91.69 |
|
| £85-90K |
0.34% |
0.37% |
91.34 |
|
| £90-95K |
0.28% |
0.31% |
91.06 |
|
| £95-100K |
0.23% |
0.25% |
90.85 |
|
| £100K + |
1.23% |
1.34% |
91.45 |
|
|
|

|


|
1992-1997
|
1997-2001
|
|
|
|
| Con |
-11.49% |
| Lab |
6.62% |
| LD |
0.70% |
|
| Con |
-3.33% |
| Lab |
-7.43% |
| LD |
8.73% |
|
|
 |
Andrew Smith
Labour hold
|
| Con |
 |
7,446 |
18.69% |
| Lab |
 |
19,681 |
49.39% |
| LD |
 |
9,337 |
23.43% |
| Oth |
 |
3,384 |
8.49% |
| Maj |
 |
10,344 |
25.96% |
| Turn |
 |
39,848 |
53.54% |
|
|
 |
Andrew Smith
Labour hold
|
| SL |
Fahim Ahmed |
274 |
0.69% |
| UK |
Peter Gardner |
570 |
1.43% |
| LD |
Steve Goddard |
9,337 |
23.43% |
| P |
Linda Hodge |
254 |
0.64% |
| SA |
John Lister |
708 |
1.78% |
| I |
Pathmanathan Mylvaganan |
77 |
0.19% |
| C |
Cheryl Potter |
7,446 |
18.69% |
| G |
Pritam Singh |
1,501 |
3.77% |
| L |
Andrew Smith |
19,681 |
49.39% |
|
Candidates representing 9 parties stood for election to this seat.
|
|
 |
Andrew Smith
Labour
|
| Con |
 |
10,540 |
22.01% |
| Lab |
 |
27,205 |
56.82% |
| LD |
 |
7,038 |
14.70% |
| Ref |
 |
1,391 |
2.91% |
| Oth |
 |
1,703 |
3.56% |
| Maj |
 |
16,665 |
34.81% |
| Turn |
 |
47,877 |
69.05% |
|
|
 |
|
Labour
|
| Con |
 |
16,718 |
33.50% |
| Lab |
 |
25,031 |
50.20% |
| LD |
 |
6,971 |
14.00% |
| Oth |
 |
1,112 |
2.20% |
| Maj |
 |
8,313 |
16.70% |
| Turn |
 |
49,832 |
72.95% |
|
|
 |
|

|

