|
Oxford West & Abingdon
Liberal Democrat hold

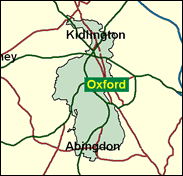
The sophisticated and intellectual seat of Oxford West and Abingdon is liberally inclined, well used to tactical voting, and well disposed to Liberal Democrats in local government elections; they have 22 out of 23 councillors (in the most recent May 1999 elections) in that part of the Vale of White Horse district within this seat, and if any other party is on the advance in west Oxford it is the Greens. The Conservatives have no councillors in this part of Oxford, nor have had for some years, and do not seem credible challengers to Evan Harris in this constituency, which includes the vast majority of the 'dreaming spires' of the elite and ancient collegiate university, and not a few of its aspiring dreams.

Dr Evan Harris, currently Liberal Democrat higher education spokesman, was elected here, in a seat where the higher education scarcely gets any higher, in 1997. A former hospital doctor at the Radcliffe, he was born in 1965 and educated at the Blue Coat School, Liverpool and Wadham College, Oxford. Handsome - if with a rather staring gaze - he was previously as Health spokesman strongly in favour of legalising homosexual sex at 16 to make young men more accessible to medical advice, and in February 2001 introduced a bill to legalise human embryo cloning.
 |
| Wealthy Achievers, Suburban Areas |
20.85% |
14.99% |
139.04 |
|
| Affluent Greys, Rural Communities |
0.28% |
2.13% |
12.96 |
|
| Prosperous Pensioners, Retirement Areas |
1.77% |
2.49% |
71.25 |
|
| Affluent Executives, Family Areas |
10.17% |
4.43% |
229.93 |
|
| Well-Off Workers, Family Areas |
9.22% |
7.27% |
126.81 |
|
| Affluent Urbanites, Town & City Areas |
9.25% |
2.56% |
360.67 |
|
| Prosperous Professionals, Metropolitan Areas |
5.05% |
2.04% |
247.27 |
|
| Better-Off Executives, Inner City Areas |
13.57% |
3.94% |
344.00 |
|
| Comfortable Middle Agers, Mature Home Owning Areas |
15.86% |
13.04% |
121.62 |
|
| Skilled Workers, Home Owning Areas |
2.30% |
12.70% |
18.14 |
|
| New Home Owners, Mature Communities |
3.74% |
8.14% |
45.97 |
|
| White Collar Workers, Better-Off Multi Ethnic Areas |
1.33% |
4.02% |
33.11 |
|
| Older People, Less Prosperous Areas |
1.07% |
3.19% |
33.73 |
|
| Council Estate Residents, Better-Off Homes |
4.89% |
11.31% |
43.21 |
|
| Council Estate Residents, High Unemployment |
0.00% |
3.06% |
0.00 |
|
| Council Estate Residents, Greatest Hardship |
0.00% |
2.52% |
0.00 |
|
| People in Multi-Ethnic, Low-Income Areas |
0.00% |
2.10% |
0.00 |
|
| Unclassified |
0.64% |
0.06% |
1,034.50 |
|
|
 |
 |
 |
| £0-5K |
5.43% |
9.41% |
57.69 |
|
| £5-10K |
11.52% |
16.63% |
69.25 |
|
| £10-15K |
13.74% |
16.58% |
82.85 |
|
| £15-20K |
13.00% |
13.58% |
95.72 |
|
| £20-25K |
11.12% |
10.39% |
107.03 |
|
| £25-30K |
9.07% |
7.77% |
116.65 |
|
| £30-35K |
7.23% |
5.79% |
124.74 |
|
| £35-40K |
5.70% |
4.33% |
131.52 |
|
| £40-45K |
4.48% |
3.27% |
137.21 |
|
| £45-50K |
3.53% |
2.48% |
142.01 |
|
| £50-55K |
2.78% |
1.90% |
146.09 |
|
| £55-60K |
2.21% |
1.47% |
149.59 |
|
| £60-65K |
1.76% |
1.15% |
152.61 |
|
| £65-70K |
1.41% |
0.91% |
155.25 |
|
| £70-75K |
1.13% |
0.72% |
157.57 |
|
| £75-80K |
0.92% |
0.57% |
159.64 |
|
| £80-85K |
0.75% |
0.46% |
161.48 |
|
| £85-90K |
0.61% |
0.37% |
163.15 |
|
| £90-95K |
0.50% |
0.31% |
164.67 |
|
| £95-100K |
0.42% |
0.25% |
166.07 |
|
| £100K + |
2.32% |
1.34% |
172.84 |
|
|
|

|


|
1992-1997
|
1997-2001
|
|
|
|
| Con |
-13.55% |
| Lab |
4.10% |
| LD |
7.12% |
|
| Con |
-2.63% |
| Lab |
-2.53% |
| LD |
4.92% |
|
|
 |
Evan Harris
Liberal Democrat hold
|
| Con |
 |
15,485 |
30.03% |
| Lab |
 |
9,114 |
17.67% |
| LD |
 |
24,670 |
47.84% |
| Oth |
 |
2,299 |
4.46% |
| Maj |
 |
9,185 |
17.81% |
| Turn |
 |
51,568 |
64.53% |
|
|
 |
Evan Harris
Liberal Democrat hold
|
| LD |
Evan Harris |
24,670 |
47.84% |
| L |
Gillian Kirk |
9,114 |
17.67% |
| C |
Ed Matts |
15,485 |
30.03% |
| I |
Sigrid Shreeve |
332 |
0.64% |
| EC |
Robert Twigger |
93 |
0.18% |
| UK |
Marcus Watney |
451 |
0.87% |
| G |
Mike Woodin |
1,423 |
2.76% |
|
Candidates representing 7 parties stood for election to this seat.
|
|
 |
Evan Harris
Liberal Democrat gain
|
| Con |
 |
19,983 |
32.65% |
| Lab |
 |
12,361 |
20.20% |
| LD |
 |
26,268 |
42.92% |
| Ref |
 |
1,258 |
2.06% |
| Oth |
 |
1,326 |
2.17% |
| Maj |
 |
6,285 |
10.27% |
| Turn |
 |
61,196 |
77.14% |
|
|
 |
|
Conservative
|
| Con |
 |
27,630 |
46.20% |
| Lab |
 |
9,642 |
16.10% |
| LD |
 |
21,408 |
35.80% |
| Oth |
 |
1,069 |
1.80% |
| Maj |
 |
6,222 |
10.40% |
| Turn |
 |
59,749 |
76.73% |
|
|
 |
|

|

