|
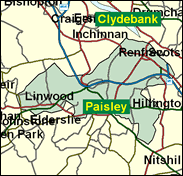
Paisley North
Labour hold

The two Paisley seats seem to march hand in hand as far as election results are concerned, and that includes the 1999 Scottish Parliament elections, where the situation, almost identically, saw Labour about fifteen pc ahead of the SNP, with none of the other parties reaching double figure percentages. Nor are these the only links between the two. Wendy Alexander is the MSP for North; her brother Douglas is Westminster MP for South. The MP for North is Irene Adams, who took the seat held by her late husband in a by-election in 1990.

Irene Adams, elected here in 1990 in succession to her late husband Allen Adams, is identified as a strong devolutionist with the more nationalist wing of the Labour Party in Scotland, and with factional in-fighting in the Labour Party in Renfrewshire, one alleged by-product of which was the suicide of Dr Gordon McMaster, her Paisley South friend and colleague in 1997, following a feud with Tommy Graham MP. She was born locally in 1947 and educated at Stanely Green High School, Paisley and worked as her husband's secretary. She backed Prescott, not Blair, for leader in 1994, and has bravely challenged local drug gangs.
 |
| Wealthy Achievers, Suburban Areas |
4.64% |
14.99% |
30.98 |
|
| Affluent Greys, Rural Communities |
0.00% |
2.13% |
0.00 |
|
| Prosperous Pensioners, Retirement Areas |
1.06% |
2.49% |
42.74 |
|
| Affluent Executives, Family Areas |
1.03% |
4.43% |
23.24 |
|
| Well-Off Workers, Family Areas |
8.03% |
7.27% |
110.36 |
|
| Affluent Urbanites, Town & City Areas |
3.03% |
2.56% |
118.23 |
|
| Prosperous Professionals, Metropolitan Areas |
1.55% |
2.04% |
76.09 |
|
| Better-Off Executives, Inner City Areas |
5.00% |
3.94% |
126.74 |
|
| Comfortable Middle Agers, Mature Home Owning Areas |
4.19% |
13.04% |
32.11 |
|
| Skilled Workers, Home Owning Areas |
6.72% |
12.70% |
52.90 |
|
| New Home Owners, Mature Communities |
1.05% |
8.14% |
12.92 |
|
| White Collar Workers, Better-Off Multi Ethnic Areas |
0.00% |
4.02% |
0.00 |
|
| Older People, Less Prosperous Areas |
6.61% |
3.19% |
207.49 |
|
| Council Estate Residents, Better-Off Homes |
23.49% |
11.31% |
207.70 |
|
| Council Estate Residents, High Unemployment |
19.28% |
3.06% |
629.57 |
|
| Council Estate Residents, Greatest Hardship |
14.31% |
2.52% |
568.36 |
|
| People in Multi-Ethnic, Low-Income Areas |
0.00% |
2.10% |
0.00 |
|
| Unclassified |
0.00% |
0.06% |
0.00 |
|
|
 |
 |
 |
| £0-5K |
12.76% |
9.41% |
135.56 |
|
| £5-10K |
19.90% |
16.63% |
119.63 |
|
| £10-15K |
18.10% |
16.58% |
109.20 |
|
| £15-20K |
13.81% |
13.58% |
101.70 |
|
| £20-25K |
9.94% |
10.39% |
95.67 |
|
| £25-30K |
7.03% |
7.77% |
90.43 |
|
| £30-35K |
4.96% |
5.79% |
85.67 |
|
| £35-40K |
3.52% |
4.33% |
81.27 |
|
| £40-45K |
2.52% |
3.27% |
77.20 |
|
| £45-50K |
1.82% |
2.48% |
73.42 |
|
| £50-55K |
1.33% |
1.90% |
69.94 |
|
| £55-60K |
0.98% |
1.47% |
66.73 |
|
| £60-65K |
0.73% |
1.15% |
63.77 |
|
| £65-70K |
0.55% |
0.91% |
61.06 |
|
| £70-75K |
0.42% |
0.72% |
58.57 |
|
| £75-80K |
0.32% |
0.57% |
56.29 |
|
| £80-85K |
0.25% |
0.46% |
54.19 |
|
| £85-90K |
0.20% |
0.37% |
52.26 |
|
| £90-95K |
0.15% |
0.31% |
50.48 |
|
| £95-100K |
0.12% |
0.25% |
48.84 |
|
| £100K + |
0.55% |
1.34% |
41.01 |
|
|
|

|


|
1992-1997
|
1997-2001
|
|
|
|
| Con |
-6.13% |
| Lab |
7.56% |
| LD |
-0.77% |
| SNP |
-1.58% |
|
| Con |
-0.72% |
| Lab |
-4.00% |
| LD |
3.05% |
| SNP |
-0.79% |
|
|
 |
Irene Adams
Labour hold
|
| Con |
 |
2,404 |
8.85% |
| Lab |
 |
15,058 |
55.46% |
| LD |
 |
2,709 |
9.98% |
| SNP |
 |
5,737 |
21.13% |
| Oth |
 |
1,245 |
4.59% |
| Maj |
 |
9,321 |
34.33% |
| Turn |
 |
27,153 |
56.58% |
|
|
 |
Irene Adams
Labour hold
|
| SNP |
George Adam |
5,737 |
21.13% |
| L |
Irene Adams |
15,058 |
55.46% |
| P |
Robert Graham |
263 |
0.97% |
| SSP |
Jim Halfpenny |
982 |
3.62% |
| LD |
Jane Hook |
2,709 |
9.98% |
| C |
Craig Stevenson |
2,404 |
8.85% |
|
Candidates representing 6 parties stood for election to this seat.
|
|
 |
Irene Adams
Labour
|
| Con |
 |
3,267 |
9.57% |
| Lab |
 |
20,295 |
59.46% |
| LD |
 |
2,365 |
6.93% |
| SNP |
 |
7,481 |
21.92% |
| Ref |
 |
196 |
0.57% |
| Oth |
 |
531 |
1.56% |
| Maj |
 |
12,814 |
37.54% |
| Turn |
 |
34,135 |
68.65% |
|
|
 |
|
Labour
|
| Con |
 |
5,757 |
15.70% |
| Lab |
 |
19,043 |
51.90% |
| LD |
 |
2,828 |
7.70% |
| SNP |
 |
8,629 |
23.50% |
| Oth |
 |
456 |
1.20% |
| Maj |
 |
10,414 |
28.40% |
| Turn |
 |
36,713 |
73.87% |
|
|
 |
|

|

