|
Pendle
Labour hold

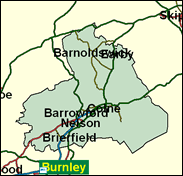
Although Labour did relatively badly in other Lancashire local elections in May 2000 (see Hyndburn and Rossendale, for example, both of which like Pendle were gained by Labour not in 1992 but in the "poll tax" affected election of 1992, which particularly affected the residents of small terraced houses), they did retain a lead in the popular vote here in this Pennine constituency which includes Nelson and Colne and Barrowford and Barnoldswick. Gordon Prentice enters the next General Election as a pretty firm favourite.

Gordon Prentice, once part of a model husband-and-wife team of Hammersmith-councillors-turned MPs in 1992, has parted both domestically and politically from his wife, Bridget (who is PPS to the Lord Chancellor). Despite seven years as a Labour Party staffer and seven months as PPS to Gavin Strang, he quit in December 1997 in order to vote against lone parent benefit cuts, and to follow that up with a string of rebellious votes on freedom of information, the prime minister's right to nominate life peers, pensions linked to average earnings, disability benefit cuts and air traffic control privatisation. Born 1951 and educated at George Heriot's School, Edinburgh and Glasgow University, an apparatchik oddly transformed into a sardonic rebel, he has sprayed mocking comments all over the Dome, Lib-Labbery and Tony Blair personally, at one point observing that "that we cling on to his every word".
 |
| Wealthy Achievers, Suburban Areas |
9.27% |
14.99% |
61.86 |
|
| Affluent Greys, Rural Communities |
0.15% |
2.13% |
7.12 |
|
| Prosperous Pensioners, Retirement Areas |
0.12% |
2.49% |
4.82 |
|
| Affluent Executives, Family Areas |
1.13% |
4.43% |
25.43 |
|
| Well-Off Workers, Family Areas |
3.11% |
7.27% |
42.72 |
|
| Affluent Urbanites, Town & City Areas |
0.00% |
2.56% |
0.00 |
|
| Prosperous Professionals, Metropolitan Areas |
0.00% |
2.04% |
0.00 |
|
| Better-Off Executives, Inner City Areas |
0.00% |
3.94% |
0.00 |
|
| Comfortable Middle Agers, Mature Home Owning Areas |
4.82% |
13.04% |
36.94 |
|
| Skilled Workers, Home Owning Areas |
46.32% |
12.70% |
364.61 |
|
| New Home Owners, Mature Communities |
3.90% |
8.14% |
47.93 |
|
| White Collar Workers, Better-Off Multi Ethnic Areas |
1.49% |
4.02% |
37.08 |
|
| Older People, Less Prosperous Areas |
2.60% |
3.19% |
81.77 |
|
| Council Estate Residents, Better-Off Homes |
20.60% |
11.31% |
182.13 |
|
| Council Estate Residents, High Unemployment |
1.35% |
3.06% |
43.95 |
|
| Council Estate Residents, Greatest Hardship |
1.15% |
2.52% |
45.70 |
|
| People in Multi-Ethnic, Low-Income Areas |
3.99% |
2.10% |
190.08 |
|
| Unclassified |
0.00% |
0.06% |
0.00 |
|
|
 |
 |
 |
| £0-5K |
11.80% |
9.41% |
125.40 |
|
| £5-10K |
20.28% |
16.63% |
121.94 |
|
| £10-15K |
18.89% |
16.58% |
113.91 |
|
| £15-20K |
14.29% |
13.58% |
105.17 |
|
| £20-25K |
10.08% |
10.39% |
96.94 |
|
| £25-30K |
6.97% |
7.77% |
89.62 |
|
| £30-35K |
4.82% |
5.79% |
83.25 |
|
| £35-40K |
3.37% |
4.33% |
77.75 |
|
| £40-45K |
2.38% |
3.27% |
73.00 |
|
| £45-50K |
1.71% |
2.48% |
68.90 |
|
| £50-55K |
1.24% |
1.90% |
65.34 |
|
| £55-60K |
0.92% |
1.47% |
62.22 |
|
| £60-65K |
0.68% |
1.15% |
59.49 |
|
| £65-70K |
0.52% |
0.91% |
57.07 |
|
| £70-75K |
0.39% |
0.72% |
54.92 |
|
| £75-80K |
0.30% |
0.57% |
53.00 |
|
| £80-85K |
0.24% |
0.46% |
51.27 |
|
| £85-90K |
0.19% |
0.37% |
49.70 |
|
| £90-95K |
0.15% |
0.31% |
48.28 |
|
| £95-100K |
0.12% |
0.25% |
46.99 |
|
| £100K + |
0.55% |
1.34% |
41.03 |
|
|
|

|


|
1992-1997
|
1997-2001
|
|
|
|
| Con |
-10.04% |
| Lab |
9.08% |
| LD |
-3.39% |
|
| Con |
3.60% |
| Lab |
-8.66% |
| LD |
2.18% |
|
|
 |
Gordon Prentice
Labour hold
|
| Con |
 |
13,454 |
33.86% |
| Lab |
 |
17,729 |
44.62% |
| LD |
 |
5,479 |
13.79% |
| Oth |
 |
3,070 |
7.73% |
| Maj |
 |
4,275 |
10.76% |
| Turn |
 |
39,732 |
63.20% |
|
|
 |
Gordon Prentice
Labour hold
|
| UK |
Graham Cannon |
1,094 |
2.75% |
| BNP |
Christian Jackson |
1,976 |
4.97% |
| L |
Gordon Prentice |
17,729 |
44.62% |
| C |
Rasjid Skinner |
13,454 |
33.86% |
| LD |
David Whipp |
5,479 |
13.79% |
|
Candidates representing 5 parties stood for election to this seat.
|
|
 |
Gordon Prentice
Labour
|
| Con |
 |
14,235 |
30.26% |
| Lab |
 |
25,059 |
53.28% |
| LD |
 |
5,460 |
11.61% |
| Ref |
 |
2,281 |
4.85% |
| Oth |
|
0 |
0.00% |
| Maj |
 |
10,824 |
23.01% |
| Turn |
 |
47,035 |
74.60% |
|
|
 |
|
Labour
|
| Con |
 |
21,384 |
40.30% |
| Lab |
 |
23,497 |
44.20% |
| LD |
 |
7,976 |
15.00% |
| Oth |
 |
263 |
0.50% |
| Maj |
 |
2,113 |
4.00% |
| Turn |
 |
53,120 |
82.24% |
|
|
 |
|

|

