|
Penrith & The Border
Conservative hold

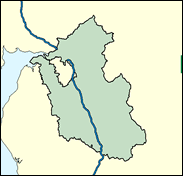
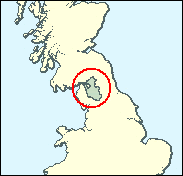
The largest seat in area in England, this massive northern Cumbrian constituency stretches from the Solway Firth to the Yorkshire Dales, from the Scottish border at Gretna Green to Helvellyn in the heart of the Lakes. The only towns of note are Penrith, Appleby with its "gypsy" horse fair, the largest in England and Wigton, the home town of Lord (Melvyn) Bragg, who thought it typical enough to write a book about it called Speak for England. The seat does not share Lord Bragg's impeccable New Labour credentials, though, and indeed both Labour and the Liberal Democrats seem lost among all these acres. It was only close once, in the by-election held in 1983 on the elevation of long-time favourite William Whitelaw to the Lords. This seat may be held to be perhaps the most influential in one way, though, as it lies at the very heart of the disease-racked area with its funeral pyres of thousands of animals, which apparently persuaded Tony Blair to postpone the General Election from May 3 to June 7. This decision will not help his party's chances in Penrith and the Border - and maybe was not designed with so limited an aim.

David Maclean is one of a number of ambitious Scots Tories who, in order to pursue their political ambitions, had to depart what was by 1997 the Tory-free zone north of "the border" featured in the name of his seat. Replacing Willie Whitelaw at a byelection in 1983, he rose from Whip to minister of state in 10 years (in which he refused an offer of a Cabinet post - Agriculture - in order to stay with Michael Howard at the Home Office), but immediately disappeared from the front bench in opposition in 1997. A pin-striped, abrasive right-winger with an emphatic style of oratory, born 1953 and educated at Fortrose Academy and Aberdeen University, and formerly working for Securicor, he has taken to specialising in wrecking private members' bills, notably politically-correct ones on subjects such as fur farming.
 |
| Wealthy Achievers, Suburban Areas |
15.33% |
14.99% |
102.22 |
|
| Affluent Greys, Rural Communities |
29.98% |
2.13% |
1,410.11 |
|
| Prosperous Pensioners, Retirement Areas |
0.52% |
2.49% |
21.06 |
|
| Affluent Executives, Family Areas |
0.00% |
4.43% |
0.00 |
|
| Well-Off Workers, Family Areas |
1.76% |
7.27% |
24.24 |
|
| Affluent Urbanites, Town & City Areas |
1.25% |
2.56% |
48.79 |
|
| Prosperous Professionals, Metropolitan Areas |
0.00% |
2.04% |
0.00 |
|
| Better-Off Executives, Inner City Areas |
0.13% |
3.94% |
3.28 |
|
| Comfortable Middle Agers, Mature Home Owning Areas |
17.67% |
13.04% |
135.51 |
|
| Skilled Workers, Home Owning Areas |
11.16% |
12.70% |
87.87 |
|
| New Home Owners, Mature Communities |
10.30% |
8.14% |
126.52 |
|
| White Collar Workers, Better-Off Multi Ethnic Areas |
3.42% |
4.02% |
85.06 |
|
| Older People, Less Prosperous Areas |
3.86% |
3.19% |
121.33 |
|
| Council Estate Residents, Better-Off Homes |
4.17% |
11.31% |
36.86 |
|
| Council Estate Residents, High Unemployment |
0.04% |
3.06% |
1.21 |
|
| Council Estate Residents, Greatest Hardship |
0.40% |
2.52% |
15.75 |
|
| People in Multi-Ethnic, Low-Income Areas |
0.00% |
2.10% |
0.00 |
|
| Unclassified |
0.00% |
0.06% |
0.00 |
|
|
 |
|
|
| £0-5K |
7.23% |
9.41% |
76.84 |
|
| £5-10K |
15.72% |
16.63% |
94.51 |
|
| £10-15K |
17.33% |
16.58% |
104.52 |
|
| £15-20K |
14.85% |
13.58% |
109.33 |
|
| £20-25K |
11.51% |
10.39% |
110.75 |
|
| £25-30K |
8.56% |
7.77% |
110.07 |
|
| £30-35K |
6.26% |
5.79% |
108.16 |
|
| £35-40K |
4.57% |
4.33% |
105.52 |
|
| £40-45K |
3.35% |
3.27% |
102.48 |
|
| £45-50K |
2.46% |
2.48% |
99.26 |
|
| £50-55K |
1.83% |
1.90% |
95.99 |
|
| £55-60K |
1.37% |
1.47% |
92.73 |
|
| £60-65K |
1.03% |
1.15% |
89.55 |
|
| £65-70K |
0.78% |
0.91% |
86.47 |
|
| £70-75K |
0.60% |
0.72% |
83.51 |
|
| £75-80K |
0.46% |
0.57% |
80.69 |
|
| £80-85K |
0.36% |
0.46% |
77.99 |
|
| £85-90K |
0.28% |
0.37% |
75.42 |
|
| £90-95K |
0.22% |
0.31% |
72.98 |
|
| £95-100K |
0.18% |
0.25% |
70.66 |
|
| £100K + |
0.78% |
1.34% |
58.40 |
|
|
|
|


|
1992-1997
|
1997-2001
|
|
|
|
| Con |
-11.11% |
| Lab |
10.60% |
| LD |
-2.31% |
|
| Con |
7.33% |
| Lab |
-3.12% |
| LD |
-4.94% |
|
|
|
David MacLean
Conservative hold
|
| Con |
 |
24,302 |
54.92% |
| Lab |
 |
8,177 |
18.48% |
| LD |
 |
9,625 |
21.75% |
| Oth |
 |
2,145 |
4.85% |
| Maj |
 |
14,677 |
33.17% |
| Turn |
|
44,249 |
65.29% |
|
|
|
David MacLean
Conservative hold
|
| L |
Michael Boaden |
8,177 |
18.48% |
| LCA |
Mark Gibson |
870 |
1.97% |
| UK |
Thomas Lowther |
938 |
2.12% |
| C |
David MacLean |
24,302 |
54.92% |
| I |
John Moffat |
337 |
0.76% |
| LD |
Kenneth Walker |
9,625 |
21.75% |
|
Candidates representing 6 parties stood for election to this seat.
|
|
|
David Maclean
Conservative
|
| Con |
|
23,300 |
47.59% |
| Lab |
|
10,576 |
21.60% |
| LD |
|
13,067 |
26.69% |
| Ref |
 |
2,018 |
4.12% |
| Oth |
|
0 |
0.00% |
| Maj |
|
10,233 |
20.90% |
| Turn |
|
48,961 |
73.63% |
|
|
|
|
Conservative
|
| Con |
|
30,030 |
58.70% |
| Lab |
|
5,644 |
11.00% |
| LD |
|
14,848 |
29.00% |
| Oth |
|
633 |
1.20% |
| Maj |
|
15,182 |
29.70% |
| Turn |
|
51,155 |
79.54% |
|
|
|
|
|