|
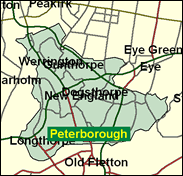
Peterborough
Labour hold

Peterborough has seen some desperately close parliamentary battles, notably in 1966 and February 1974 (6 vote and 22 vote majorities respectively) and who is to say that this will not happen again next time? In the May 2000 unitary council elections in Peterborough, for example, the Conservatives, who will be trying to regain the seat from Labour's Helen Brinton at the next General Election, won a number of wards with huge majorities: in West, Werrington, and Park for example. This seat will remain competitive.

Helen Brinton attracted much adverse publicity immediately after her election in 1997 as an on-message Blairite android, before falling well out of public gaze. Emerging from an all-women shortlist and self-confessedly "totally without ideological baggage," she is a former teacher, born 1947, and educated at Spondon Park Grammar School, Derby and Bristol University. Toothy and naÔve-seeming, she now reflects the contemporary Labour activists' concern for animal welfare, but in the early nineties backed Bryan Gould's Keynesian 'Full Employment Forum'.
 |
| Wealthy Achievers, Suburban Areas |
10.90% |
14.99% |
72.67 |
|
| Affluent Greys, Rural Communities |
0.00% |
2.13% |
0.00 |
|
| Prosperous Pensioners, Retirement Areas |
0.66% |
2.49% |
26.54 |
|
| Affluent Executives, Family Areas |
9.77% |
4.43% |
220.70 |
|
| Well-Off Workers, Family Areas |
3.45% |
7.27% |
47.38 |
|
| Affluent Urbanites, Town & City Areas |
1.10% |
2.56% |
42.80 |
|
| Prosperous Professionals, Metropolitan Areas |
0.11% |
2.04% |
5.41 |
|
| Better-Off Executives, Inner City Areas |
1.56% |
3.94% |
39.57 |
|
| Comfortable Middle Agers, Mature Home Owning Areas |
10.68% |
13.04% |
81.91 |
|
| Skilled Workers, Home Owning Areas |
11.95% |
12.70% |
94.11 |
|
| New Home Owners, Mature Communities |
13.52% |
8.14% |
165.97 |
|
| White Collar Workers, Better-Off Multi Ethnic Areas |
4.59% |
4.02% |
114.03 |
|
| Older People, Less Prosperous Areas |
4.81% |
3.19% |
150.91 |
|
| Council Estate Residents, Better-Off Homes |
19.40% |
11.31% |
171.49 |
|
| Council Estate Residents, High Unemployment |
1.25% |
3.06% |
40.85 |
|
| Council Estate Residents, Greatest Hardship |
2.33% |
2.52% |
92.43 |
|
| People in Multi-Ethnic, Low-Income Areas |
3.94% |
2.10% |
187.70 |
|
| Unclassified |
0.00% |
0.06% |
0.00 |
|
|
 |
 |
 |
| £0-5K |
12.22% |
9.41% |
129.83 |
|
| £5-10K |
19.87% |
16.63% |
119.49 |
|
| £10-15K |
18.41% |
16.58% |
111.02 |
|
| £15-20K |
14.05% |
13.58% |
103.45 |
|
| £20-25K |
10.05% |
10.39% |
96.70 |
|
| £25-30K |
7.05% |
7.77% |
90.69 |
|
| £30-35K |
4.94% |
5.79% |
85.34 |
|
| £35-40K |
3.49% |
4.33% |
80.56 |
|
| £40-45K |
2.49% |
3.27% |
76.29 |
|
| £45-50K |
1.80% |
2.48% |
72.45 |
|
| £50-55K |
1.31% |
1.90% |
69.00 |
|
| £55-60K |
0.97% |
1.47% |
65.88 |
|
| £60-65K |
0.73% |
1.15% |
63.05 |
|
| £65-70K |
0.55% |
0.91% |
60.48 |
|
| £70-75K |
0.42% |
0.72% |
58.13 |
|
| £75-80K |
0.32% |
0.57% |
55.98 |
|
| £80-85K |
0.25% |
0.46% |
54.01 |
|
| £85-90K |
0.20% |
0.37% |
52.19 |
|
| £90-95K |
0.15% |
0.31% |
50.52 |
|
| £95-100K |
0.12% |
0.25% |
48.97 |
|
| £100K + |
0.56% |
1.34% |
41.59 |
|
|
|

|


|
1992-1997
|
1997-2001
|
|
|
|
| Con |
-14.31% |
| Lab |
12.51% |
| LD |
1.38% |
|
| Con |
2.79% |
| Lab |
-5.16% |
| LD |
3.79% |
|
|
 |
Helen Brinton
Labour hold
|
| Con |
 |
15,121 |
37.98% |
| Lab |
 |
17,975 |
45.15% |
| LD |
 |
5,761 |
14.47% |
| Oth |
 |
955 |
2.40% |
| Maj |
 |
2,854 |
7.17% |
| Turn |
 |
39,812 |
61.33% |
|
|
 |
Helen Brinton
Labour hold
|
| L |
Helen Brinton |
17,975 |
45.15% |
| UK |
Julian Fairweather |
955 |
2.40% |
| C |
Stewart Jackson |
15,121 |
37.98% |
| LD |
Nick Sandford |
5,761 |
14.47% |
|
Candidates representing 4 parties stood for election to this seat.
|
|
 |
Helen Brinton
Labour gain
|
| Con |
 |
17,042 |
35.19% |
| Lab |
 |
24,365 |
50.31% |
| LD |
 |
5,170 |
10.68% |
| Ref |
 |
924 |
1.91% |
| Oth |
 |
926 |
1.91% |
| Maj |
 |
7,323 |
15.12% |
| Turn |
 |
48,427 |
73.46% |
|
|
 |
|
Conservative
|
| Con |
 |
26,455 |
49.50% |
| Lab |
 |
20,201 |
37.80% |
| LD |
 |
4,973 |
9.30% |
| Oth |
 |
1,839 |
3.40% |
| Maj |
 |
6,254 |
11.70% |
| Turn |
 |
53,468 |
74.46% |
|
|
 |
|

|

