|
Plymouth, Devonport
Labour hold

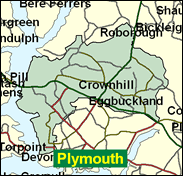
A seat with a famous name, represented over the years by, among others, Michael Foot, Dame Joan Vickers and Dr David Owen. These politicians are most associated with the Labour, Conservative and SDP parties respectively, which gives some idea of the competitive nature of Devonport over the years, although there have also been sweeping boundary changes on several occasions too. Now the dockland area of Plymouth is combined with the city's northern swathe of council estates to create a very working class, strongly Labour seat which David Jamieson held by 19,000 in 1997, and it no longer looks marginal at all; actually, it never looked marginal physically, but the service (in this case Royal Navy) influence on a seat almost always skews its politics to the Right.

David Jamieson, elected here for Labour in the wake of David Owen in 1992, is a former school teacher, born 1947 and educated at Tudor Grange Grammar School, Solihull and St Peter's Teacher Training College, Birmingham. A defender of local defence interests, he also piloted a bill on regulation of activity centres following the drowning of Plymouth schoolchildren off Lyme Regis and engaged in a good deal of name calling with Plymouth Tory MP Gary Streeter over the latter's SDP Tory-baiting past, before falling silent as a Whip in 1997.
 |
| Wealthy Achievers, Suburban Areas |
4.71% |
14.99% |
31.40 |
|
| Affluent Greys, Rural Communities |
0.06% |
2.13% |
2.67 |
|
| Prosperous Pensioners, Retirement Areas |
0.36% |
2.49% |
14.51 |
|
| Affluent Executives, Family Areas |
7.13% |
4.43% |
161.17 |
|
| Well-Off Workers, Family Areas |
6.27% |
7.27% |
86.21 |
|
| Affluent Urbanites, Town & City Areas |
1.06% |
2.56% |
41.47 |
|
| Prosperous Professionals, Metropolitan Areas |
0.00% |
2.04% |
0.00 |
|
| Better-Off Executives, Inner City Areas |
2.48% |
3.94% |
62.83 |
|
| Comfortable Middle Agers, Mature Home Owning Areas |
5.68% |
13.04% |
43.56 |
|
| Skilled Workers, Home Owning Areas |
16.03% |
12.70% |
126.17 |
|
| New Home Owners, Mature Communities |
11.82% |
8.14% |
145.16 |
|
| White Collar Workers, Better-Off Multi Ethnic Areas |
0.88% |
4.02% |
21.94 |
|
| Older People, Less Prosperous Areas |
7.36% |
3.19% |
230.92 |
|
| Council Estate Residents, Better-Off Homes |
27.68% |
11.31% |
244.72 |
|
| Council Estate Residents, High Unemployment |
1.99% |
3.06% |
65.00 |
|
| Council Estate Residents, Greatest Hardship |
6.49% |
2.52% |
257.87 |
|
| People in Multi-Ethnic, Low-Income Areas |
0.00% |
2.10% |
0.00 |
|
| Unclassified |
0.00% |
0.06% |
0.00 |
|
|
 |
 |
 |
| £0-5K |
13.24% |
9.41% |
140.65 |
|
| £5-10K |
24.13% |
16.63% |
145.07 |
|
| £10-15K |
21.38% |
16.58% |
128.93 |
|
| £15-20K |
14.86% |
13.58% |
109.36 |
|
| £20-25K |
9.49% |
10.39% |
91.35 |
|
| £25-30K |
5.92% |
7.77% |
76.16 |
|
| £30-35K |
3.70% |
5.79% |
63.82 |
|
| £35-40K |
2.34% |
4.33% |
53.95 |
|
| £40-45K |
1.51% |
3.27% |
46.11 |
|
| £45-50K |
0.99% |
2.48% |
39.87 |
|
| £50-55K |
0.66% |
1.90% |
34.88 |
|
| £55-60K |
0.45% |
1.47% |
30.84 |
|
| £60-65K |
0.32% |
1.15% |
27.56 |
|
| £65-70K |
0.23% |
0.91% |
24.86 |
|
| £70-75K |
0.16% |
0.72% |
22.62 |
|
| £75-80K |
0.12% |
0.57% |
20.75 |
|
| £80-85K |
0.09% |
0.46% |
19.17 |
|
| £85-90K |
0.07% |
0.37% |
17.83 |
|
| £90-95K |
0.05% |
0.31% |
16.68 |
|
| £95-100K |
0.04% |
0.25% |
15.69 |
|
| £100K + |
0.17% |
1.34% |
12.30 |
|
|
|

|


|
1992-1997
|
1997-2001
|
|
|
|
| Con |
-11.43% |
| Lab |
13.87% |
| LD |
-2.48% |
|
| Con |
2.88% |
| Lab |
-2.57% |
| LD |
0.10% |
|
|
 |
David Jamieson
Labour hold
|
| Con |
 |
11,289 |
27.06% |
| Lab |
 |
24,322 |
58.30% |
| LD |
 |
4,513 |
10.82% |
| Oth |
 |
1,595 |
3.82% |
| Maj |
 |
13,033 |
31.24% |
| Turn |
 |
41,719 |
56.63% |
|
|
 |
David Jamieson
Labour hold
|
| LD |
Keith Baldry |
4,513 |
10.82% |
| C |
John Glen |
11,289 |
27.06% |
| SL |
Rob Hawkins |
303 |
0.73% |
| L |
David Jamieson |
24,322 |
58.30% |
| UK |
Michael Parker |
958 |
2.30% |
| SA |
Tony Staunton |
334 |
0.80% |
|
Candidates representing 6 parties stood for election to this seat.
|
|
 |
David Jamieson
Labour
|
| Con |
 |
12,562 |
24.17% |
| Lab |
 |
31,629 |
60.87% |
| LD |
 |
5,570 |
10.72% |
| Ref |
 |
1,486 |
2.86% |
| Oth |
 |
716 |
1.38% |
| Maj |
 |
19,067 |
36.69% |
| Turn |
 |
51,963 |
69.76% |
|
|
 |
|
Labour
|
| Con |
 |
21,111 |
35.60% |
| Lab |
 |
27,877 |
47.00% |
| LD |
 |
7,830 |
13.20% |
| Oth |
 |
2,445 |
4.10% |
| Maj |
 |
6,766 |
11.40% |
| Turn |
 |
59,263 |
78.43% |
|
|
 |
|

|

