|
Plymouth, Sutton
Labour hold

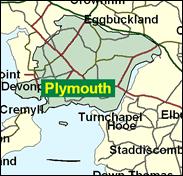
The Conservatives topped the poll in seven of the eight wards that are included within the Sutton seat in the all-out Plymouth unitary council elections in May 2000, although several of these were close enough to bring split representation. All this betokens a titanic battle in the western seafaring city, and it would be very difficult to predict the winner in advance. It would be a very good result for the Conservatives if they were to oust Linda Gilroy, however, for this would equate to a ten pc swing since the 1997 General Election.

Linda Gilroy, Labour victor here in 1997 after selection from an all-women shortlist, was Scots-born in 1949 and educated at Stirling High School, Edinburgh and Strathclyde Universities. She worked previously for the Gas Consumer Council and operates in the House as an inevitable defender of Plymouth's defence interests, as a bowler of planted questions, and as an instigator of legislation to regulate fireworks.
 |
| Wealthy Achievers, Suburban Areas |
4.70% |
14.99% |
31.34 |
|
| Affluent Greys, Rural Communities |
0.00% |
2.13% |
0.00 |
|
| Prosperous Pensioners, Retirement Areas |
1.32% |
2.49% |
53.02 |
|
| Affluent Executives, Family Areas |
1.40% |
4.43% |
31.62 |
|
| Well-Off Workers, Family Areas |
1.31% |
7.27% |
18.03 |
|
| Affluent Urbanites, Town & City Areas |
3.91% |
2.56% |
152.65 |
|
| Prosperous Professionals, Metropolitan Areas |
0.01% |
2.04% |
0.63 |
|
| Better-Off Executives, Inner City Areas |
21.45% |
3.94% |
543.83 |
|
| Comfortable Middle Agers, Mature Home Owning Areas |
6.49% |
13.04% |
49.80 |
|
| Skilled Workers, Home Owning Areas |
13.20% |
12.70% |
103.94 |
|
| New Home Owners, Mature Communities |
6.48% |
8.14% |
79.59 |
|
| White Collar Workers, Better-Off Multi Ethnic Areas |
21.06% |
4.02% |
523.59 |
|
| Older People, Less Prosperous Areas |
2.91% |
3.19% |
91.36 |
|
| Council Estate Residents, Better-Off Homes |
6.97% |
11.31% |
61.60 |
|
| Council Estate Residents, High Unemployment |
6.09% |
3.06% |
198.95 |
|
| Council Estate Residents, Greatest Hardship |
2.47% |
2.52% |
98.22 |
|
| People in Multi-Ethnic, Low-Income Areas |
0.00% |
2.10% |
0.00 |
|
| Unclassified |
0.22% |
0.06% |
352.71 |
|
|
 |
 |
 |
| £0-5K |
12.67% |
9.41% |
134.62 |
|
| £5-10K |
21.82% |
16.63% |
131.17 |
|
| £10-15K |
19.75% |
16.58% |
119.14 |
|
| £15-20K |
14.42% |
13.58% |
106.16 |
|
| £20-25K |
9.80% |
10.39% |
94.31 |
|
| £25-30K |
6.54% |
7.77% |
84.11 |
|
| £30-35K |
4.37% |
5.79% |
75.50 |
|
| £35-40K |
2.96% |
4.33% |
68.29 |
|
| £40-45K |
2.03% |
3.27% |
62.26 |
|
| £45-50K |
1.42% |
2.48% |
57.19 |
|
| £50-55K |
1.01% |
1.90% |
52.90 |
|
| £55-60K |
0.73% |
1.47% |
49.25 |
|
| £60-65K |
0.53% |
1.15% |
46.13 |
|
| £65-70K |
0.39% |
0.91% |
43.44 |
|
| £70-75K |
0.30% |
0.72% |
41.11 |
|
| £75-80K |
0.22% |
0.57% |
39.07 |
|
| £80-85K |
0.17% |
0.46% |
37.29 |
|
| £85-90K |
0.13% |
0.37% |
35.71 |
|
| £90-95K |
0.10% |
0.31% |
34.32 |
|
| £95-100K |
0.08% |
0.25% |
33.07 |
|
| £100K + |
0.38% |
1.34% |
28.01 |
|
|
|

|


|
1992-1997
|
1997-2001
|
|
|
|
| Con |
-11.49% |
| Lab |
10.32% |
| LD |
-2.52% |
|
| Con |
1.20% |
| Lab |
0.63% |
| LD |
0.47% |
|
|
 |
Linda Gilroy
Labour hold
|
| Con |
 |
12,310 |
31.51% |
| Lab |
 |
19,827 |
50.74% |
| LD |
 |
5,605 |
14.34% |
| Oth |
 |
1,331 |
3.41% |
| Maj |
 |
7,517 |
19.24% |
| Turn |
 |
39,073 |
57.09% |
|
|
 |
Linda Gilroy
Labour hold
|
| C |
Oliver Colvile |
12,310 |
31.51% |
| LD |
Alan Connett |
5,605 |
14.34% |
| UK |
Alan Connett |
970 |
2.48% |
| LC |
Linda Gilroy |
19,827 |
50.74% |
| SL |
Henry Leary |
361 |
0.92% |
|
Candidates representing 5 parties stood for election to this seat.
|
|
 |
Linda Gilroy
Labour gain
|
| Con |
 |
14,441 |
30.31% |
| Lab |
 |
23,881 |
50.12% |
| LD |
 |
6,613 |
13.88% |
| Ref |
 |
1,654 |
3.47% |
| Oth |
 |
1,063 |
2.23% |
| Maj |
 |
9,440 |
19.81% |
| Turn |
 |
47,652 |
67.43% |
|
|
 |
|
Conservative
|
| Con |
 |
22,049 |
41.80% |
| Lab |
 |
20,989 |
39.80% |
| LD |
 |
8,673 |
16.40% |
| Oth |
 |
1,076 |
2.00% |
| Maj |
 |
1,060 |
2.00% |
| Turn |
 |
52,787 |
79.10% |
|
|
 |
|

|

