|
Pontefract & Castleford
Labour hold

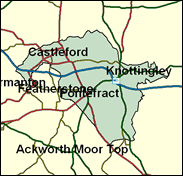
As one travels eastwards from Leeds, the Pennine countryside gradually flattens into a plain, and the traditional base of the economy changes from textiles to coal. Great rivers like the Aire and the Ouse water the low-lying land, and have been tapped by massive power stations which tower over the landscape. This is scenery dominated by heavy industry, by the production of power and energy. One travels too from the City of Leeds into the City of Wakefield, where there have been no Tory seats since well before the war. The pits which dominated Castleford are gone now, but not their ambience, and Knottingley is nearly as monolithic, dominated by the Ferrybridge power station. Pontefact is a historic town with a famous castle, and there are some Conservative votes in its southern ward, but this seat is mighty safe for a somewhat unlikely figure, the young and rising Labour MP Yvette Cooper.

Yvette Cooper, one of Labour's 1997-vintage jeunesse d'orée, was elected following her airlifting here, after the last minute ennoblement of Sir Geoffrey Lofthouse. Dubbed the "dazzling star of the Blairite nomenklatura," a former staffer for Gordon Brown in Opposition, and wife of Treasury adviser Ed Balls, she duly joined the government as a Junior Health Minister in 1999. Born 1969 and educated at Eggars Comprehensive School, Alton, Balliol College Oxford, Harvard and the LSE, with elfin good looks as well as brains, and her career tucked in around babies - with maternity leave planned for her second one in 2001 - she is the object of flattering if un-PC plaudits from veteran Tory Knights of the Shire such as Sir Peter Emery.
 |
| Wealthy Achievers, Suburban Areas |
4.14% |
14.99% |
27.59 |
|
| Affluent Greys, Rural Communities |
0.00% |
2.13% |
0.00 |
|
| Prosperous Pensioners, Retirement Areas |
0.00% |
2.49% |
0.00 |
|
| Affluent Executives, Family Areas |
1.91% |
4.43% |
43.24 |
|
| Well-Off Workers, Family Areas |
8.39% |
7.27% |
115.31 |
|
| Affluent Urbanites, Town & City Areas |
0.00% |
2.56% |
0.00 |
|
| Prosperous Professionals, Metropolitan Areas |
0.00% |
2.04% |
0.00 |
|
| Better-Off Executives, Inner City Areas |
0.00% |
3.94% |
0.00 |
|
| Comfortable Middle Agers, Mature Home Owning Areas |
6.21% |
13.04% |
47.63 |
|
| Skilled Workers, Home Owning Areas |
28.59% |
12.70% |
225.07 |
|
| New Home Owners, Mature Communities |
17.11% |
8.14% |
210.11 |
|
| White Collar Workers, Better-Off Multi Ethnic Areas |
0.39% |
4.02% |
9.75 |
|
| Older People, Less Prosperous Areas |
5.28% |
3.19% |
165.81 |
|
| Council Estate Residents, Better-Off Homes |
17.97% |
11.31% |
158.89 |
|
| Council Estate Residents, High Unemployment |
3.39% |
3.06% |
110.77 |
|
| Council Estate Residents, Greatest Hardship |
6.61% |
2.52% |
262.63 |
|
| People in Multi-Ethnic, Low-Income Areas |
0.00% |
2.10% |
0.00 |
|
| Unclassified |
0.00% |
0.06% |
0.00 |
|
|
 |
 |
 |
| £0-5K |
12.18% |
9.41% |
129.39 |
|
| £5-10K |
21.53% |
16.63% |
129.44 |
|
| £10-15K |
19.65% |
16.58% |
118.50 |
|
| £15-20K |
14.43% |
13.58% |
106.23 |
|
| £20-25K |
9.88% |
10.39% |
95.06 |
|
| £25-30K |
6.65% |
7.77% |
85.48 |
|
| £30-35K |
4.48% |
5.79% |
77.42 |
|
| £35-40K |
3.06% |
4.33% |
70.66 |
|
| £40-45K |
2.12% |
3.27% |
64.98 |
|
| £45-50K |
1.49% |
2.48% |
60.20 |
|
| £50-55K |
1.07% |
1.90% |
56.14 |
|
| £55-60K |
0.78% |
1.47% |
52.67 |
|
| £60-65K |
0.57% |
1.15% |
49.70 |
|
| £65-70K |
0.43% |
0.91% |
47.13 |
|
| £70-75K |
0.32% |
0.72% |
44.90 |
|
| £75-80K |
0.25% |
0.57% |
42.96 |
|
| £80-85K |
0.19% |
0.46% |
41.25 |
|
| £85-90K |
0.15% |
0.37% |
39.74 |
|
| £90-95K |
0.12% |
0.31% |
38.41 |
|
| £95-100K |
0.09% |
0.25% |
37.22 |
|
| £100K + |
0.43% |
1.34% |
32.35 |
|
|
|

|


|
1992-1997
|
1997-2001
|
|
|
|
| Con |
-7.34% |
| Lab |
5.81% |
| LD |
-1.85% |
|
| Con |
4.00% |
| Lab |
-5.97% |
| LD |
0.03% |
|
|
 |
Yvette Cooper
Labour hold
|
| Con |
 |
5,512 |
17.56% |
| Lab |
 |
21,890 |
69.73% |
| LD |
 |
2,315 |
7.37% |
| Oth |
 |
1,674 |
5.33% |
| Maj |
 |
16,378 |
52.17% |
| Turn |
 |
31,391 |
49.68% |
|
|
 |
Yvette Cooper
Labour hold
|
| SL |
Trevor Bolderson |
605 |
1.93% |
| UK |
John Burdon |
739 |
2.35% |
| L |
Yvette Cooper |
21,890 |
69.73% |
| SA |
John Gill |
330 |
1.05% |
| LD |
Wesley Paxton |
2,315 |
7.37% |
| C |
Pamela Singleton |
5,512 |
17.56% |
|
Candidates representing 6 parties stood for election to this seat.
|
|
 |
Yvette Cooper
Labour
|
| Con |
 |
5,614 |
13.56% |
| Lab |
 |
31,339 |
75.71% |
| LD |
 |
3,042 |
7.35% |
| Ref |
 |
1,401 |
3.38% |
| Oth |
|
0 |
0.00% |
| Maj |
 |
25,725 |
62.14% |
| Turn |
 |
41,396 |
66.39% |
|
|
 |
|
Labour
|
| Con |
 |
10,051 |
20.90% |
| Lab |
 |
33,546 |
69.90% |
| LD |
 |
4,410 |
9.20% |
| Oth |
|
0 |
0.00% |
| Maj |
 |
23,495 |
48.90% |
| Turn |
 |
48,007 |
73.07% |
|
|
 |
|

|

