|
Berwick-upon-Tweed
Liberal Democrat hold

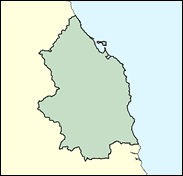
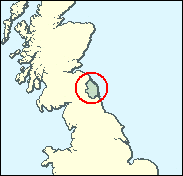
Alan Beith has held the most northerly seat in England for nearly 30 years, and has converted it into something almost unknown when he was first elected in a by-election in 1973 - a safe Liberal seat. He won several times narrowly before becoming established. It is hard to see where a challenge to the Lib Dems would come from even if Beith were to retire, as one presumes he must one day; Labour and Conservatives almost exactly divided the opposition in 1997.

The Liberal Democrats' perennial Deputy Leader, Alan Beith, won this seat on the back of a Tory call-girl scandal in 1973 and has subsequently converted it into a relatively safe
seat. An astigmatic and uncharismatic Methodist of straight-laced views on tobacco, Sunday trading, abortion, embryo research and pornography, he also, with other rural Liberal Democrat MPs, shuns politically correct lines on gun bans and hunting. Born in 1943 and educated at King's School, Macclesfield and Balliol and Nuffield Colleges, Oxford, he was a Politics lecturer at Newcastle University for seven years. A disappointed candidate for Speaker in 2000, with Labour in second place in Berwick in 1997 he now finds himself out of step with the national Lib-Lab strategy, which in a handful of LibDem-held seats like his, does not fit local circumstances.
 |
| Wealthy Achievers, Suburban Areas |
9.69% |
14.99% |
64.65 |
|
| Affluent Greys, Rural Communities |
17.52% |
2.13% |
823.99 |
|
| Prosperous Pensioners, Retirement Areas |
2.00% |
2.49% |
80.54 |
|
| Affluent Executives, Family Areas |
1.24% |
4.43% |
28.11 |
|
| Well-Off Workers, Family Areas |
3.18% |
7.27% |
43.72 |
|
| Affluent Urbanites, Town & City Areas |
0.00% |
2.56% |
0.00 |
|
| Prosperous Professionals, Metropolitan Areas |
0.12% |
2.04% |
5.87 |
|
| Better-Off Executives, Inner City Areas |
0.47% |
3.94% |
12.01 |
|
| Comfortable Middle Agers, Mature Home Owning Areas |
15.98% |
13.04% |
122.55 |
|
| Skilled Workers, Home Owning Areas |
11.44% |
12.70% |
90.06 |
|
| New Home Owners, Mature Communities |
16.80% |
8.14% |
206.36 |
|
| White Collar Workers, Better-Off Multi Ethnic Areas |
3.25% |
4.02% |
80.89 |
|
| Older People, Less Prosperous Areas |
4.04% |
3.19% |
126.96 |
|
| Council Estate Residents, Better-Off Homes |
11.72% |
11.31% |
103.60 |
|
| Council Estate Residents, High Unemployment |
1.01% |
3.06% |
32.83 |
|
| Council Estate Residents, Greatest Hardship |
1.52% |
2.52% |
60.52 |
|
| People in Multi-Ethnic, Low-Income Areas |
0.00% |
2.10% |
0.00 |
|
| Unclassified |
0.00% |
0.06% |
0.00 |
|
|
 |
 |
 |
| £0-5K |
10.26% |
9.41% |
108.97 |
|
| £5-10K |
19.35% |
16.63% |
116.33 |
|
| £10-15K |
18.81% |
16.58% |
113.45 |
|
| £15-20K |
14.59% |
13.58% |
107.40 |
|
| £20-25K |
10.47% |
10.39% |
100.72 |
|
| £25-30K |
7.33% |
7.77% |
94.33 |
|
| £30-35K |
5.13% |
5.79% |
88.53 |
|
| £35-40K |
3.61% |
4.33% |
83.36 |
|
| £40-45K |
2.57% |
3.27% |
78.80 |
|
| £45-50K |
1.86% |
2.48% |
74.77 |
|
| £50-55K |
1.36% |
1.90% |
71.20 |
|
| £55-60K |
1.00% |
1.47% |
68.03 |
|
| £60-65K |
0.75% |
1.15% |
65.19 |
|
| £65-70K |
0.57% |
0.91% |
62.65 |
|
| £70-75K |
0.43% |
0.72% |
60.35 |
|
| £75-80K |
0.33% |
0.57% |
58.26 |
|
| £80-85K |
0.26% |
0.46% |
56.36 |
|
| £85-90K |
0.20% |
0.37% |
54.62 |
|
| £90-95K |
0.16% |
0.31% |
53.02 |
|
| £95-100K |
0.13% |
0.25% |
51.54 |
|
| £100K + |
0.60% |
1.34% |
44.40 |
|
|
|

|


|
1992-1997
|
1997-2001
|
|
|
|
| Con |
-8.74% |
| Lab |
3.33% |
| LD |
1.07% |
|
| Con |
4.02% |
| Lab |
-8.51% |
| LD |
5.90% |
|
|
 |
Alan Beith
Liberal Democrat hold
|
| Con |
 |
10,193 |
28.07% |
| Lab |
 |
6,435 |
17.72% |
| LD |
 |
18,651 |
51.37% |
| Oth |
 |
1,029 |
2.83% |
| Maj |
 |
8,458 |
23.30% |
| Turn |
 |
36,308 |
63.79% |
|
|
 |
Alan Beith
Liberal Democrat hold
|
| LD |
Alan Beith |
18,651 |
51.37% |
| UK |
John Pearson |
1,029 |
2.83% |
| C |
Glen Sanderson |
10,193 |
28.07% |
| L |
Martin Walker |
6,435 |
17.72% |
|
Candidates representing 4 parties stood for election to this seat.
|
|
 |
Alan Beith
Liberal Democrat
|
| Con |
 |
10,056 |
24.06% |
| Lab |
 |
10,965 |
26.23% |
| LD |
 |
19,007 |
45.47% |
| Ref |
 |
1,423 |
3.40% |
| Oth |
 |
352 |
0.84% |
| Maj |
 |
8,042 |
19.24% |
| Turn |
 |
41,803 |
74.08% |
|
|
 |
|
Liberal Democrat
|
| Con |
 |
14,240 |
32.80% |
| Lab |
 |
9,933 |
22.90% |
| LD |
 |
19,283 |
44.40% |
| Oth |
|
0 |
0.00% |
| Maj |
 |
5,043 |
11.60% |
| Turn |
 |
43,456 |
78.45% |
|
|
 |
|

|

