|
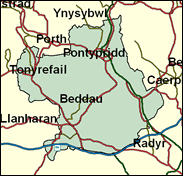
Pontypridd
Labour hold

As with most of the South Wales valley seats, Plaid Cymru pressed Labour closely in the first past the post constituency section of the first ever Assembly elections, held in May 1999; as with the others, they are very unlikely to do so again in the very different circumstance of a United Kingdom General Election in 2001, especially as New Labour will not again be so foolish as to present the Welsh voters with three potential leaders within the space of a few months.

Dr Kim Howells, junior DTI minister, elected at a by-election in 1989, has travelled the full distance from organiser of the 1968 Hornsey College of Art sit-in, and three years in the CP, to pronouncing the end of the 'S' (for socialism) word in 1996, for which apostasy he probably owes his ministerial car at the dangerously advanced age of 55. Born 1946, son of a Communist lorry driver, he attended Mountain Ash Grammar School, Hornsey College of Art, Cambridgeshire College of Arts & Technology and Warwick University, and worked successively as a lecturer, broadcaster and NUM research officer. A gregarious, extrovert boyo, as a former opponent of devolution he came to endorse it, but on age grounds alone the backbenches must beckon in 2001. In April this year he pronounced the Royal Family "a bit bonkers".
 |
| Wealthy Achievers, Suburban Areas |
11.84% |
14.99% |
78.94 |
|
| Affluent Greys, Rural Communities |
0.00% |
2.13% |
0.00 |
|
| Prosperous Pensioners, Retirement Areas |
0.30% |
2.49% |
12.15 |
|
| Affluent Executives, Family Areas |
9.49% |
4.43% |
214.49 |
|
| Well-Off Workers, Family Areas |
14.40% |
7.27% |
197.95 |
|
| Affluent Urbanites, Town & City Areas |
0.81% |
2.56% |
31.74 |
|
| Prosperous Professionals, Metropolitan Areas |
0.06% |
2.04% |
3.07 |
|
| Better-Off Executives, Inner City Areas |
3.15% |
3.94% |
79.94 |
|
| Comfortable Middle Agers, Mature Home Owning Areas |
8.92% |
13.04% |
68.38 |
|
| Skilled Workers, Home Owning Areas |
22.69% |
12.70% |
178.64 |
|
| New Home Owners, Mature Communities |
9.89% |
8.14% |
121.49 |
|
| White Collar Workers, Better-Off Multi Ethnic Areas |
2.17% |
4.02% |
54.08 |
|
| Older People, Less Prosperous Areas |
4.12% |
3.19% |
129.48 |
|
| Council Estate Residents, Better-Off Homes |
8.77% |
11.31% |
77.51 |
|
| Council Estate Residents, High Unemployment |
0.25% |
3.06% |
8.11 |
|
| Council Estate Residents, Greatest Hardship |
3.05% |
2.52% |
121.03 |
|
| People in Multi-Ethnic, Low-Income Areas |
0.00% |
2.10% |
0.00 |
|
| Unclassified |
0.08% |
0.06% |
126.86 |
|
|
 |
 |
 |
| £0-5K |
9.58% |
9.41% |
101.74 |
|
| £5-10K |
16.89% |
16.63% |
101.53 |
|
| £10-15K |
17.09% |
16.58% |
103.10 |
|
| £15-20K |
14.10% |
13.58% |
103.77 |
|
| £20-25K |
10.72% |
10.39% |
103.15 |
|
| £25-30K |
7.89% |
7.77% |
101.55 |
|
| £30-35K |
5.75% |
5.79% |
99.35 |
|
| £35-40K |
4.20% |
4.33% |
96.88 |
|
| £40-45K |
3.08% |
3.27% |
94.32 |
|
| £45-50K |
2.28% |
2.48% |
91.81 |
|
| £50-55K |
1.70% |
1.90% |
89.39 |
|
| £55-60K |
1.28% |
1.47% |
87.10 |
|
| £60-65K |
0.98% |
1.15% |
84.95 |
|
| £65-70K |
0.75% |
0.91% |
82.94 |
|
| £70-75K |
0.58% |
0.72% |
81.05 |
|
| £75-80K |
0.46% |
0.57% |
79.28 |
|
| £80-85K |
0.36% |
0.46% |
77.63 |
|
| £85-90K |
0.28% |
0.37% |
76.07 |
|
| £90-95K |
0.23% |
0.31% |
74.60 |
|
| £95-100K |
0.18% |
0.25% |
73.22 |
|
| £100K + |
0.88% |
1.34% |
65.70 |
|
|
|

|


|
1992-1997
|
1997-2001
|
|
|
|
| Con |
-7.41% |
| Lab |
3.08% |
| LD |
4.94% |
| PC |
-2.61% |
|
| Con |
0.41% |
| Lab |
-3.93% |
| LD |
-2.60% |
| PC |
7.29% |
|
|
 |
Kim Howells
Labour hold
|
| Con |
 |
5,096 |
13.30% |
| Lab |
 |
22,963 |
59.94% |
| LD |
 |
4,152 |
10.84% |
| PC |
 |
5,279 |
13.78% |
| Oth |
 |
819 |
2.14% |
| Maj |
 |
17,684 |
46.16% |
| Turn |
 |
38,309 |
57.95% |
|
|
 |
Kim Howells
Labour hold
|
| P |
Joseph Biddulph |
216 |
0.56% |
| LD |
Eric Brooke |
4,152 |
10.84% |
| C |
Prudence Dailey |
5,096 |
13.30% |
| PC |
Bleddyn Hancock |
5,279 |
13.78% |
| L |
Kim Howells |
22,963 |
59.94% |
| UK |
Sue Warry |
603 |
1.57% |
|
Candidates representing 6 parties stood for election to this seat.
|
|
 |
Kim Howells
Labour
|
| Con |
 |
5,910 |
12.89% |
| Lab |
 |
29,290 |
63.88% |
| LD |
 |
6,161 |
13.44% |
| PC |
 |
2,977 |
6.49% |
| Ref |
 |
874 |
1.91% |
| Oth |
 |
643 |
1.40% |
| Maj |
 |
23,129 |
50.44% |
| Turn |
 |
45,855 |
71.44% |
|
|
 |
|
Labour
|
| Con |
 |
9,925 |
20.30% |
| Lab |
 |
29,722 |
60.80% |
| LD |
 |
4,180 |
8.50% |
| PC |
 |
4,448 |
9.10% |
| Oth |
 |
615 |
1.30% |
| Maj |
 |
19,797 |
40.50% |
| Turn |
 |
48,890 |
76.94% |
|
|
 |
|

|

