|
Poole
Conservative hold

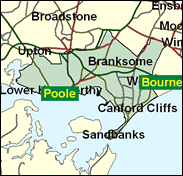
An affluent and economically booming seat containing one of the two or three areas of highest residential land value in the whole of Britain (Sandbanks on Poole Harbour) according to a 2000 report, Poole should remain Conservative. In the May 1999 unitary authority elections here they returned 15 councillors to the Liberal Democrats' six and Labour's three; the wards split 5:2:1.

Robert Syms, an Environment spokesman, was elected in 1997, a rightwing Eurosceptic and owner of a Chippenham-based family building and plant hire firm, who rose politically as leader of North Wiltshire District Council. Born 1956 and educated at Colston's School, Bristol, a would-be Portillo-supporter who backed Lilley in 1997, he favours first-past-the-post over PR.
 |
| Wealthy Achievers, Suburban Areas |
17.64% |
14.99% |
117.64 |
|
| Affluent Greys, Rural Communities |
1.59% |
2.13% |
74.62 |
|
| Prosperous Pensioners, Retirement Areas |
16.90% |
2.49% |
679.59 |
|
| Affluent Executives, Family Areas |
0.55% |
4.43% |
12.42 |
|
| Well-Off Workers, Family Areas |
6.82% |
7.27% |
93.77 |
|
| Affluent Urbanites, Town & City Areas |
0.36% |
2.56% |
14.19 |
|
| Prosperous Professionals, Metropolitan Areas |
1.23% |
2.04% |
60.40 |
|
| Better-Off Executives, Inner City Areas |
2.35% |
3.94% |
59.56 |
|
| Comfortable Middle Agers, Mature Home Owning Areas |
27.92% |
13.04% |
214.11 |
|
| Skilled Workers, Home Owning Areas |
6.32% |
12.70% |
49.76 |
|
| New Home Owners, Mature Communities |
4.73% |
8.14% |
58.03 |
|
| White Collar Workers, Better-Off Multi Ethnic Areas |
3.58% |
4.02% |
89.09 |
|
| Older People, Less Prosperous Areas |
3.68% |
3.19% |
115.46 |
|
| Council Estate Residents, Better-Off Homes |
4.30% |
11.31% |
38.02 |
|
| Council Estate Residents, High Unemployment |
1.63% |
3.06% |
53.08 |
|
| Council Estate Residents, Greatest Hardship |
0.41% |
2.52% |
16.36 |
|
| People in Multi-Ethnic, Low-Income Areas |
0.00% |
2.10% |
0.00 |
|
| Unclassified |
0.00% |
0.06% |
0.00 |
|
|
 |
 |
 |
| £0-5K |
9.13% |
9.41% |
97.02 |
|
| £5-10K |
17.40% |
16.63% |
104.60 |
|
| £10-15K |
17.73% |
16.58% |
106.94 |
|
| £15-20K |
14.42% |
13.58% |
106.16 |
|
| £20-25K |
10.78% |
10.39% |
103.73 |
|
| £25-30K |
7.82% |
7.77% |
100.63 |
|
| £30-35K |
5.64% |
5.79% |
97.40 |
|
| £35-40K |
4.09% |
4.33% |
94.32 |
|
| £40-45K |
2.99% |
3.27% |
91.52 |
|
| £45-50K |
2.21% |
2.48% |
89.05 |
|
| £50-55K |
1.66% |
1.90% |
86.90 |
|
| £55-60K |
1.25% |
1.47% |
85.06 |
|
| £60-65K |
0.96% |
1.15% |
83.50 |
|
| £65-70K |
0.74% |
0.91% |
82.18 |
|
| £70-75K |
0.58% |
0.72% |
81.07 |
|
| £75-80K |
0.46% |
0.57% |
80.14 |
|
| £80-85K |
0.37% |
0.46% |
79.37 |
|
| £85-90K |
0.29% |
0.37% |
78.73 |
|
| £90-95K |
0.24% |
0.31% |
78.21 |
|
| £95-100K |
0.19% |
0.25% |
77.78 |
|
| £100K + |
1.03% |
1.34% |
77.00 |
|
|
|

|


|
1992-1997
|
1997-2001
|
|
|
|
| Con |
-12.96% |
| Lab |
9.88% |
| LD |
1.52% |
|
| Con |
3.00% |
| Lab |
5.30% |
| LD |
-5.31% |
|
|
 |
Robert Syms
Conservative hold
|
| Con |
 |
17,710 |
45.14% |
| Lab |
 |
10,544 |
26.88% |
| LD |
 |
10,011 |
25.52% |
| Oth |
 |
968 |
2.47% |
| Maj |
 |
7,166 |
18.27% |
| Turn |
 |
39,233 |
60.69% |
|
|
 |
Robert Syms
Conservative hold
|
| UK |
John Bass |
968 |
2.47% |
| C |
Robert Syms |
17,710 |
45.14% |
| L |
David Watt |
10,544 |
26.88% |
| LD |
Nick Westbrook |
10,011 |
25.52% |
|
Candidates representing 4 parties stood for election to this seat.
|
|
 |
Robert Syms
Conservative
|
| Con |
 |
19,726 |
42.14% |
| Lab |
 |
10,100 |
21.58% |
| LD |
 |
14,428 |
30.82% |
| Ref |
 |
1,932 |
4.13% |
| Oth |
 |
624 |
1.33% |
| Maj |
 |
5,298 |
11.32% |
| Turn |
 |
46,810 |
70.84% |
|
|
 |
|
Conservative
|
| Con |
 |
27,768 |
55.10% |
| Lab |
 |
5,880 |
11.70% |
| LD |
 |
14,787 |
29.30% |
| Oth |
 |
1,950 |
3.90% |
| Maj |
 |
12,981 |
25.80% |
| Turn |
 |
50,385 |
78.38% |
|
|
 |
|

|

