|
Poplar & Canning Town
Labour hold

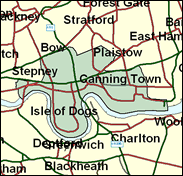
This is the heart of the old London docklands, now much modernised by both residential and industrial and trading development, and containing riverside wards of the London Boroughs of Tower Hamlets and Newham. Here are the London City airport and several new stations on the Docklands Light Railway and Jubilee Extension. Here too are new housing developments such as that at Beckton. But there are also unreconstructed parts of the classic East End such as the Isle of Dogs. A far-right British National party candidate, Derek Beackon, was elected for the Millwall ward which covers the Isle in a Tower Hamlets council by-election in 1993, and although after a massive storm he was removed in the May 1994 contests, the underlying racial tension remains in several parts of the seat, and the BNP leader John Tyndall obtained their best share of the vote anywhere in the 1997 General Election, saving his deposit with 7pc. Labour look likely to hold this seat, but there may be unfortunate problems and incidents along the way.

Jim Fitzpatrick, PPS to Alan Milburn, and as a former member of the Socialist Workers' Party, sharing with Milburn a leftwing past, was elected here in 1997. A neatly-coiffured, poker-faced Scot, born 1952 and Catholic-educated at Holy Cross School and Holyrood Secondary School, Glasgow, he was a fireman or Fire Brigade Union official for 23 years. Chairman of the London Labour Party since 1991, he rebelled against student grant abolition in 1998, and has more recently backed the Livingstone-Kiley plan for the Tube.
 |
| Wealthy Achievers, Suburban Areas |
0.01% |
14.99% |
0.09 |
|
| Affluent Greys, Rural Communities |
0.00% |
2.13% |
0.00 |
|
| Prosperous Pensioners, Retirement Areas |
0.00% |
2.49% |
0.00 |
|
| Affluent Executives, Family Areas |
0.47% |
4.43% |
10.55 |
|
| Well-Off Workers, Family Areas |
0.00% |
7.27% |
0.00 |
|
| Affluent Urbanites, Town & City Areas |
6.62% |
2.56% |
258.29 |
|
| Prosperous Professionals, Metropolitan Areas |
2.21% |
2.04% |
108.18 |
|
| Better-Off Executives, Inner City Areas |
1.61% |
3.94% |
40.88 |
|
| Comfortable Middle Agers, Mature Home Owning Areas |
0.00% |
13.04% |
0.00 |
|
| Skilled Workers, Home Owning Areas |
0.00% |
12.70% |
0.00 |
|
| New Home Owners, Mature Communities |
0.62% |
8.14% |
7.59 |
|
| White Collar Workers, Better-Off Multi Ethnic Areas |
6.44% |
4.02% |
160.17 |
|
| Older People, Less Prosperous Areas |
0.01% |
3.19% |
0.16 |
|
| Council Estate Residents, Better-Off Homes |
11.60% |
11.31% |
102.60 |
|
| Council Estate Residents, High Unemployment |
23.30% |
3.06% |
760.89 |
|
| Council Estate Residents, Greatest Hardship |
6.45% |
2.52% |
255.93 |
|
| People in Multi-Ethnic, Low-Income Areas |
40.53% |
2.10% |
1,930.02 |
|
| Unclassified |
0.13% |
0.06% |
208.18 |
|
|
 |
 |
 |
| £0-5K |
8.28% |
9.41% |
88.00 |
|
| £5-10K |
14.24% |
16.63% |
85.63 |
|
| £10-15K |
14.84% |
16.58% |
89.53 |
|
| £15-20K |
12.85% |
13.58% |
94.59 |
|
| £20-25K |
10.35% |
10.39% |
99.62 |
|
| £25-30K |
8.11% |
7.77% |
104.26 |
|
| £30-35K |
6.28% |
5.79% |
108.43 |
|
| £35-40K |
4.86% |
4.33% |
112.12 |
|
| £40-45K |
3.77% |
3.27% |
115.36 |
|
| £45-50K |
2.93% |
2.48% |
118.21 |
|
| £50-55K |
2.30% |
1.90% |
120.71 |
|
| £55-60K |
1.81% |
1.47% |
122.89 |
|
| £60-65K |
1.44% |
1.15% |
124.80 |
|
| £65-70K |
1.15% |
0.91% |
126.47 |
|
| £70-75K |
0.92% |
0.72% |
127.93 |
|
| £75-80K |
0.74% |
0.57% |
129.21 |
|
| £80-85K |
0.60% |
0.46% |
130.32 |
|
| £85-90K |
0.49% |
0.37% |
131.28 |
|
| £90-95K |
0.40% |
0.31% |
132.12 |
|
| £95-100K |
0.33% |
0.25% |
132.84 |
|
| £100K + |
1.81% |
1.34% |
134.48 |
|
|
|

|


|
1992-1997
|
1997-2001
|
|
|
|
| Con |
-10.70% |
| Lab |
11.97% |
| LD |
-9.13% |
|
| Con |
4.81% |
| Lab |
-2.01% |
| LD |
0.76% |
|
|
 |
Jim Fitzpatrick
Labour hold
|
| Con |
 |
6,758 |
19.81% |
| Lab |
 |
20,862 |
61.16% |
| LD |
 |
3,795 |
11.13% |
| Oth |
 |
2,693 |
7.90% |
| Maj |
 |
14,104 |
41.35% |
| Turn |
 |
34,108 |
45.37% |
|
|
 |
Jim Fitzpatrick
Labour hold
|
| SA |
Kambiz Boomla |
950 |
2.79% |
| BNP |
Paul Borg |
1,743 |
5.11% |
| L |
Jim Fitzpatrick |
20,862 |
61.16% |
| C |
Robert Marr |
6,758 |
19.81% |
| LD |
Alexi Sugden |
3,795 |
11.13% |
|
Candidates representing 5 parties stood for election to this seat.
|
|
 |
Jim Fitzpatrick
Labour
|
| Con |
 |
5,892 |
15.00% |
| Lab |
 |
24,807 |
63.17% |
| LD |
 |
4,072 |
10.37% |
| Ref |
 |
1,091 |
2.78% |
| Oth |
 |
3,406 |
8.67% |
| Maj |
 |
18,915 |
48.17% |
| Turn |
 |
39,268 |
58.46% |
|
|
 |
|
Labour
|
| Con |
 |
10,517 |
25.70% |
| Lab |
 |
20,935 |
51.20% |
| LD |
 |
7,986 |
19.50% |
| Oth |
 |
1,417 |
3.50% |
| Maj |
 |
10,418 |
25.50% |
| Turn |
 |
40,855 |
65.69% |
|
|
 |
|

|

