|
Portsmouth North
Labour hold

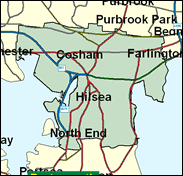
This seat obtained notoriety in the "anti-paedophile" riots of Paulsgrove of summer 2000, in which the first-term Syd Rapson, a veteran local politician and resident, played a somewhat ambiguous role. He may well feel insecure in a constituency which required most (10pc) of the 13pc swing Labour achieved in 1997 to oust Peter Griffiths. Rapson's party won only two of the six wards within the seat in the borough elections of May 2000, although this included Paulsgrove, on an 18pc turnout, and also the aptly named Nelson (17pc turnout). Working-class neighbourhoods such as these must be much better and positively motivated for Labour to hold this seat.

Syd Rapson won here for Labour in 1997, after 18 years on Portsmouth City Council. A bald and portly aircraft fitter, he was born in 1942 and educated at local secondary modern schools and Portsmouth Dockyard College. An inevitable defender of his city's defence interests, he judged it prudent in 2000 to go along with a local populist wave of hysteria against paedophiles on the Paulsgove estate, where he himself was born. His Conservative challenger is Christopher Day, born 1962, educated at St. Wifrid's School, Crawley and Imperial College London, a professional engineer who switched to management consultancy with Price Waterhouse and is now head of Business Engineering Risk Management for Europe at American Express.
 |
| Wealthy Achievers, Suburban Areas |
4.77% |
14.99% |
31.85 |
|
| Affluent Greys, Rural Communities |
0.00% |
2.13% |
0.00 |
|
| Prosperous Pensioners, Retirement Areas |
0.33% |
2.49% |
13.37 |
|
| Affluent Executives, Family Areas |
5.23% |
4.43% |
118.09 |
|
| Well-Off Workers, Family Areas |
0.45% |
7.27% |
6.21 |
|
| Affluent Urbanites, Town & City Areas |
0.63% |
2.56% |
24.59 |
|
| Prosperous Professionals, Metropolitan Areas |
0.00% |
2.04% |
0.00 |
|
| Better-Off Executives, Inner City Areas |
0.47% |
3.94% |
11.81 |
|
| Comfortable Middle Agers, Mature Home Owning Areas |
15.92% |
13.04% |
122.11 |
|
| Skilled Workers, Home Owning Areas |
40.44% |
12.70% |
318.38 |
|
| New Home Owners, Mature Communities |
5.28% |
8.14% |
64.83 |
|
| White Collar Workers, Better-Off Multi Ethnic Areas |
3.65% |
4.02% |
90.79 |
|
| Older People, Less Prosperous Areas |
3.83% |
3.19% |
120.12 |
|
| Council Estate Residents, Better-Off Homes |
16.52% |
11.31% |
146.07 |
|
| Council Estate Residents, High Unemployment |
1.43% |
3.06% |
46.73 |
|
| Council Estate Residents, Greatest Hardship |
1.04% |
2.52% |
41.45 |
|
| People in Multi-Ethnic, Low-Income Areas |
0.00% |
2.10% |
0.00 |
|
| Unclassified |
0.00% |
0.06% |
0.00 |
|
|
 |
 |
 |
| £0-5K |
9.62% |
9.41% |
102.19 |
|
| £5-10K |
18.87% |
16.63% |
113.44 |
|
| £10-15K |
18.93% |
16.58% |
114.18 |
|
| £15-20K |
15.01% |
13.58% |
110.48 |
|
| £20-25K |
10.90% |
10.39% |
104.84 |
|
| £25-30K |
7.66% |
7.77% |
98.54 |
|
| £30-35K |
5.34% |
5.79% |
92.21 |
|
| £35-40K |
3.73% |
4.33% |
86.18 |
|
| £40-45K |
2.63% |
3.27% |
80.57 |
|
| £45-50K |
1.87% |
2.48% |
75.44 |
|
| £50-55K |
1.35% |
1.90% |
70.77 |
|
| £55-60K |
0.98% |
1.47% |
66.54 |
|
| £60-65K |
0.72% |
1.15% |
62.72 |
|
| £65-70K |
0.54% |
0.91% |
59.26 |
|
| £70-75K |
0.40% |
0.72% |
56.13 |
|
| £75-80K |
0.31% |
0.57% |
53.29 |
|
| £80-85K |
0.23% |
0.46% |
50.71 |
|
| £85-90K |
0.18% |
0.37% |
48.36 |
|
| £90-95K |
0.14% |
0.31% |
46.22 |
|
| £95-100K |
0.11% |
0.25% |
44.26 |
|
| £100K + |
0.48% |
1.34% |
35.34 |
|
|
|

|


|
1992-1997
|
1997-2001
|
|
|
|
| Con |
-13.11% |
| Lab |
13.94% |
| LD |
-4.52% |
|
| Con |
-0.85% |
| Lab |
3.52% |
| LD |
-0.28% |
|
|
 |
Sydney Rapson
Labour hold
|
| Con |
 |
13,542 |
36.73% |
| Lab |
 |
18,676 |
50.66% |
| LD |
 |
3,795 |
10.29% |
| Oth |
 |
853 |
2.31% |
| Maj |
 |
5,134 |
13.93% |
| Turn |
 |
36,866 |
57.37% |
|
|
 |
Sydney Rapson
Labour hold
|
| C |
Chris Day |
13,542 |
36.73% |
| I |
Brian Heaney |
294 |
0.80% |
| UK |
William McCabe |
559 |
1.52% |
| L |
Sydney Rapson |
18,676 |
50.66% |
| LD |
Darren Sanders |
3,795 |
10.29% |
|
Candidates representing 5 parties stood for election to this seat.
|
|
 |
Syd Rapson
Labour gain
|
| Con |
 |
17,016 |
37.59% |
| Lab |
 |
21,339 |
47.14% |
| LD |
 |
4,788 |
10.58% |
| Ref |
 |
1,757 |
3.88% |
| Oth |
 |
370 |
0.82% |
| Maj |
 |
4,323 |
9.55% |
| Turn |
 |
45,270 |
70.14% |
|
|
 |
|
Conservative
|
| Con |
 |
25,368 |
50.70% |
| Lab |
 |
16,610 |
33.20% |
| LD |
 |
7,529 |
15.10% |
| Oth |
 |
511 |
1.00% |
| Maj |
 |
8,758 |
17.50% |
| Turn |
 |
50,018 |
76.23% |
|
|
 |
|

|

