|
Preseli Pembrokeshire
Labour hold

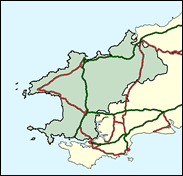
A new seat in 1997, Welsh assembly results indicate that this should stay safely Labour in the next General Election; it is not even clear who is most likely to finish second, the non-recovering Conservatives or Plaid Cymru in a three-quarters English speaking seat. This is the northern half of Pembrokeshire, named after the Preseli hills at its heart. The main towns are Haverfordwest, Fishguard, and Milford Haven, with its oil refining port. There is also the tiny cathedral city of St David's and a dramatic coastline, plus the islands of Ramsey, Skomer and Skokholm. There are few voters here, but many come to look at both the scenery and the huge avian population.

Jackie Lawrence won here for Labour in 1997, helped in her selection from an all-women shortlist by having been researcher for Pembroke MP Nick Ainger. Birmingham-born in 1948 and educated at Upperthorpe School, Darlington, she arrived in Pembrokeshire in the seventies and learned Welsh to help her children cope with bilingualism at school. A pitcher of planted questions and fully signed-up to the contemporary orthodoxies on devolution and hunting, she has done little to trouble the scorers.
 |
| Wealthy Achievers, Suburban Areas |
9.14% |
14.99% |
60.93 |
|
| Affluent Greys, Rural Communities |
30.19% |
2.13% |
1,419.66 |
|
| Prosperous Pensioners, Retirement Areas |
1.65% |
2.49% |
66.33 |
|
| Affluent Executives, Family Areas |
1.49% |
4.43% |
33.70 |
|
| Well-Off Workers, Family Areas |
0.80% |
7.27% |
11.05 |
|
| Affluent Urbanites, Town & City Areas |
0.00% |
2.56% |
0.00 |
|
| Prosperous Professionals, Metropolitan Areas |
0.00% |
2.04% |
0.00 |
|
| Better-Off Executives, Inner City Areas |
2.18% |
3.94% |
55.39 |
|
| Comfortable Middle Agers, Mature Home Owning Areas |
17.00% |
13.04% |
130.41 |
|
| Skilled Workers, Home Owning Areas |
5.25% |
12.70% |
41.36 |
|
| New Home Owners, Mature Communities |
14.71% |
8.14% |
180.58 |
|
| White Collar Workers, Better-Off Multi Ethnic Areas |
4.16% |
4.02% |
103.48 |
|
| Older People, Less Prosperous Areas |
2.44% |
3.19% |
76.52 |
|
| Council Estate Residents, Better-Off Homes |
7.84% |
11.31% |
69.32 |
|
| Council Estate Residents, High Unemployment |
0.21% |
3.06% |
6.82 |
|
| Council Estate Residents, Greatest Hardship |
2.94% |
2.52% |
116.63 |
|
| People in Multi-Ethnic, Low-Income Areas |
0.00% |
2.10% |
0.00 |
|
| Unclassified |
0.00% |
0.06% |
0.00 |
|
|
 |
 |
 |
| £0-5K |
12.28% |
9.41% |
130.43 |
|
| £5-10K |
21.08% |
16.63% |
126.75 |
|
| £10-15K |
19.47% |
16.58% |
117.43 |
|
| £15-20K |
14.53% |
13.58% |
106.99 |
|
| £20-25K |
10.07% |
10.39% |
96.93 |
|
| £25-30K |
6.82% |
7.77% |
87.78 |
|
| £30-35K |
4.62% |
5.79% |
79.70 |
|
| £35-40K |
3.15% |
4.33% |
72.63 |
|
| £40-45K |
2.17% |
3.27% |
66.49 |
|
| £45-50K |
1.52% |
2.48% |
61.15 |
|
| £50-55K |
1.08% |
1.90% |
56.49 |
|
| £55-60K |
0.77% |
1.47% |
52.43 |
|
| £60-65K |
0.56% |
1.15% |
48.86 |
|
| £65-70K |
0.41% |
0.91% |
45.72 |
|
| £70-75K |
0.31% |
0.72% |
42.94 |
|
| £75-80K |
0.23% |
0.57% |
40.47 |
|
| £80-85K |
0.18% |
0.46% |
38.27 |
|
| £85-90K |
0.14% |
0.37% |
36.29 |
|
| £90-95K |
0.11% |
0.31% |
34.51 |
|
| £95-100K |
0.08% |
0.25% |
32.90 |
|
| £100K + |
0.35% |
1.34% |
25.86 |
|
|
|

|


|
1992-1997
|
1997-2001
|
|
|
|
| Con |
-11.81% |
| Lab |
10.19% |
| LD |
0.73% |
| PC |
-2.27% |
|
| Con |
5.65% |
| Lab |
-6.94% |
| LD |
-2.48% |
| PC |
6.34% |
|
|
 |
Jackie Lawrence
Labour hold
|
| Con |
 |
12,260 |
33.34% |
| Lab |
 |
15,206 |
41.35% |
| LD |
 |
3,882 |
10.56% |
| PC |
 |
4,658 |
12.67% |
| Oth |
 |
771 |
2.10% |
| Maj |
 |
2,946 |
8.01% |
| Turn |
 |
36,777 |
67.75% |
|
|
 |
Jackie Lawrence
Labour hold
|
| SL |
Trish Bowen |
452 |
1.23% |
| C |
Stephen Crabb |
12,260 |
33.34% |
| LD |
Alexander Dauncey |
3,882 |
10.56% |
| UK |
Hugh Jones |
319 |
0.87% |
| L |
Jackie Lawrence |
15,206 |
41.35% |
| PC |
Rhys Sinnet |
4,658 |
12.67% |
|
Candidates representing 6 parties stood for election to this seat.
|
|
 |
Jackie Lawrence
Labour gain
|
| Con |
 |
11,741 |
27.69% |
| Lab |
 |
20,477 |
48.29% |
| LD |
 |
5,527 |
13.03% |
| PC |
 |
2,683 |
6.33% |
| Ref |
 |
1,574 |
3.71% |
| Oth |
 |
401 |
0.95% |
| Maj |
 |
8,736 |
20.60% |
| Turn |
 |
42,403 |
78.40% |
|
|
 |
|
Conservative
|
| Con |
 |
17,270 |
39.50% |
| Lab |
 |
16,667 |
38.10% |
| LD |
 |
5,379 |
12.30% |
| PC |
 |
3,773 |
8.60% |
| Oth |
 |
642 |
1.50% |
| Maj |
 |
603 |
1.40% |
| Turn |
 |
43,731 |
80.54% |
|
|
 |
|

|

