|
Pudsey
Labour hold

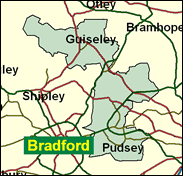
The Pudsey constituency is one of Labour's hardest gains of 1997 to defend. The member elected then, Paul Truswell, faces a situation in which the Tories polled over 11,000 votes in the most recent Leeds City Council elections in 2000 to Labour's 7,000. This is a gap which even a higher turnout will be unlikely to overcome. Yorkshire, like Lancashire and the West Midlands, seems to offer the Conservatives the best chances of gains next time.

Paul Truswell, a Leeds councillor for 15 years won this seat after 75 years of Conservative occupation in 1997. Born 1955 ad educated at Firth Park Comprehensive School, Sheffield and Leeds University, he worked successfully as journalist and local government officer before 1997, since when he has been conspicuous only for piloting through a Bill to make off-licence staff liable for sales to under age customers.
 |
| Wealthy Achievers, Suburban Areas |
15.30% |
14.99% |
102.07 |
|
| Affluent Greys, Rural Communities |
0.00% |
2.13% |
0.00 |
|
| Prosperous Pensioners, Retirement Areas |
0.21% |
2.49% |
8.57 |
|
| Affluent Executives, Family Areas |
2.71% |
4.43% |
61.27 |
|
| Well-Off Workers, Family Areas |
14.10% |
7.27% |
193.88 |
|
| Affluent Urbanites, Town & City Areas |
1.28% |
2.56% |
50.10 |
|
| Prosperous Professionals, Metropolitan Areas |
0.02% |
2.04% |
0.83 |
|
| Better-Off Executives, Inner City Areas |
0.00% |
3.94% |
0.00 |
|
| Comfortable Middle Agers, Mature Home Owning Areas |
15.09% |
13.04% |
115.69 |
|
| Skilled Workers, Home Owning Areas |
21.71% |
12.70% |
170.92 |
|
| New Home Owners, Mature Communities |
11.38% |
8.14% |
139.74 |
|
| White Collar Workers, Better-Off Multi Ethnic Areas |
3.14% |
4.02% |
78.09 |
|
| Older People, Less Prosperous Areas |
5.86% |
3.19% |
183.87 |
|
| Council Estate Residents, Better-Off Homes |
6.41% |
11.31% |
56.69 |
|
| Council Estate Residents, High Unemployment |
1.21% |
3.06% |
39.51 |
|
| Council Estate Residents, Greatest Hardship |
1.56% |
2.52% |
62.12 |
|
| People in Multi-Ethnic, Low-Income Areas |
0.00% |
2.10% |
0.00 |
|
| Unclassified |
0.01% |
0.06% |
11.85 |
|
|
 |
 |
 |
| £0-5K |
7.37% |
9.41% |
78.32 |
|
| £5-10K |
14.58% |
16.63% |
87.63 |
|
| £10-15K |
15.92% |
16.58% |
96.05 |
|
| £15-20K |
13.96% |
13.58% |
102.76 |
|
| £20-25K |
11.19% |
10.39% |
107.71 |
|
| £25-30K |
8.64% |
7.77% |
111.12 |
|
| £30-35K |
6.56% |
5.79% |
113.27 |
|
| £35-40K |
4.96% |
4.33% |
114.43 |
|
| £40-45K |
3.75% |
3.27% |
114.82 |
|
| £45-50K |
2.85% |
2.48% |
114.62 |
|
| £50-55K |
2.17% |
1.90% |
113.98 |
|
| £55-60K |
1.67% |
1.47% |
113.02 |
|
| £60-65K |
1.29% |
1.15% |
111.82 |
|
| £65-70K |
1.00% |
0.91% |
110.45 |
|
| £70-75K |
0.78% |
0.72% |
108.97 |
|
| £75-80K |
0.62% |
0.57% |
107.40 |
|
| £80-85K |
0.49% |
0.46% |
105.79 |
|
| £85-90K |
0.39% |
0.37% |
104.16 |
|
| £90-95K |
0.31% |
0.31% |
102.52 |
|
| £95-100K |
0.25% |
0.25% |
100.89 |
|
| £100K + |
1.22% |
1.34% |
90.66 |
|
|
|

|


|
1992-1997
|
1997-2001
|
|
|
|
| Con |
-7.36% |
| Lab |
19.01% |
| LD |
-12.41% |
|
| Con |
-0.72% |
| Lab |
-0.04% |
| LD |
0.23% |
|
|
 |
Paul Truswell
Labour hold
|
| Con |
 |
16,091 |
35.62% |
| Lab |
 |
21,717 |
48.07% |
| LD |
 |
6,423 |
14.22% |
| Oth |
 |
944 |
2.09% |
| Maj |
 |
5,626 |
12.45% |
| Turn |
 |
45,175 |
63.27% |
|
|
 |
Paul Truswell
Labour hold
|
| LD |
Stephen Boddy |
6,423 |
14.22% |
| C |
John Procter |
16,091 |
35.62% |
| UK |
David Sewards |
944 |
2.09% |
| L |
Paul Truswell |
21,717 |
48.07% |
|
Candidates representing 4 parties stood for election to this seat.
|
|
 |
Paul Truswell
Labour gain
|
| Con |
 |
19,163 |
36.34% |
| Lab |
 |
25,370 |
48.11% |
| LD |
 |
7,375 |
13.99% |
| Ref |
 |
823 |
1.56% |
| Oth |
|
0 |
0.00% |
| Maj |
 |
6,207 |
11.77% |
| Turn |
 |
52,731 |
74.35% |
|
|
 |
|
Conservative
|
| Con |
 |
25,067 |
43.70% |
| Lab |
 |
16,695 |
29.10% |
| LD |
 |
15,153 |
26.40% |
| Oth |
 |
466 |
0.80% |
| Maj |
 |
8,372 |
14.60% |
| Turn |
 |
57,381 |
79.61% |
|
|
 |
|

|

