|
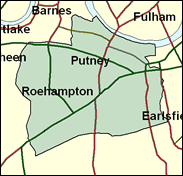
Putney
Labour hold

Elections in the London Borough of Wandsworth are always hard to call, because they have been skewed strongly towards the Conservative for many years due to the popular low-tax policies of the borough council, which has remained in their hands since 1978 while most others in London have slipped from their grasp on more than one occasion. In the most recent (May 1998), Tory candidates outpolled Labour by no less than 29pc here, the highest margin in the country in a Labour seat. Yet in 2001, if the General Election is indeed then, it is not council tax in Wandsworth which is at stake but the governance of the country, the future of New Labour, and of first-term MP Tony Colman, who slipped past the spectacular election night row between the defeated candidates David Mellor and Sir James Goldsmith almost unnoticed. The focus is more likely to be on him next time.

Tony Coleman, an unusual Labour figure as a former company director-turned-Council-leader, won this seat in 1997. Inevitably a campaigner against aircraft noise, and previously for six years leader of Merton Council and before that a chief executive, then director, at Burton's Group plc, he was born 1943 and attended Paston Grammar School, North Walsham and Magdalene College, Cambridge. Variously described as "prissy", "dapper" and "camp", with a record of complaint about the local Tory flagship, Wandsworth Council, he now faces a Conservative candidate straight off it, in Michael Simpson, winner of the Labour-held Roehampton ward as recently as 1998. Putney-based though Australian-born in 1964, he was educated at St. George's School, Harpenden and Nottingham University, served in the Royal Artillery for 4 years, and then worked in marketing, successively for Proctor & Gamble, Price Waterhouse Coopers, and currently Johnson & Johnson, where he is European Marketing Manager.
 |
| Wealthy Achievers, Suburban Areas |
2.01% |
14.99% |
13.40 |
|
| Affluent Greys, Rural Communities |
0.00% |
2.13% |
0.00 |
|
| Prosperous Pensioners, Retirement Areas |
1.15% |
2.49% |
46.41 |
|
| Affluent Executives, Family Areas |
0.00% |
4.43% |
0.00 |
|
| Well-Off Workers, Family Areas |
0.00% |
7.27% |
0.00 |
|
| Affluent Urbanites, Town & City Areas |
10.37% |
2.56% |
404.21 |
|
| Prosperous Professionals, Metropolitan Areas |
37.74% |
2.04% |
1,849.03 |
|
| Better-Off Executives, Inner City Areas |
12.41% |
3.94% |
314.65 |
|
| Comfortable Middle Agers, Mature Home Owning Areas |
0.62% |
13.04% |
4.76 |
|
| Skilled Workers, Home Owning Areas |
3.07% |
12.70% |
24.17 |
|
| New Home Owners, Mature Communities |
0.59% |
8.14% |
7.26 |
|
| White Collar Workers, Better-Off Multi Ethnic Areas |
3.00% |
4.02% |
74.51 |
|
| Older People, Less Prosperous Areas |
0.36% |
3.19% |
11.25 |
|
| Council Estate Residents, Better-Off Homes |
3.70% |
11.31% |
32.72 |
|
| Council Estate Residents, High Unemployment |
20.36% |
3.06% |
665.02 |
|
| Council Estate Residents, Greatest Hardship |
0.00% |
2.52% |
0.00 |
|
| People in Multi-Ethnic, Low-Income Areas |
4.52% |
2.10% |
215.43 |
|
| Unclassified |
0.10% |
0.06% |
153.60 |
|
|
 |
|
|
| £0-5K |
6.13% |
9.41% |
65.14 |
|
| £5-10K |
10.46% |
16.63% |
62.89 |
|
| £10-15K |
11.79% |
16.58% |
71.10 |
|
| £15-20K |
11.20% |
13.58% |
82.42 |
|
| £20-25K |
9.88% |
10.39% |
95.03 |
|
| £25-30K |
8.41% |
7.77% |
108.11 |
|
| £30-35K |
7.02% |
5.79% |
121.27 |
|
| £35-40K |
5.82% |
4.33% |
134.27 |
|
| £40-45K |
4.80% |
3.27% |
146.97 |
|
| £45-50K |
3.95% |
2.48% |
159.31 |
|
| £50-55K |
3.26% |
1.90% |
171.25 |
|
| £55-60K |
2.69% |
1.47% |
182.78 |
|
| £60-65K |
2.23% |
1.15% |
193.91 |
|
| £65-70K |
1.85% |
0.91% |
204.64 |
|
| £70-75K |
1.55% |
0.72% |
214.99 |
|
| £75-80K |
1.29% |
0.57% |
224.97 |
|
| £80-85K |
1.09% |
0.46% |
234.60 |
|
| £85-90K |
0.91% |
0.37% |
243.91 |
|
| £90-95K |
0.77% |
0.31% |
252.90 |
|
| £95-100K |
0.65% |
0.25% |
261.59 |
|
| £100K + |
4.21% |
1.34% |
313.42 |
|
|
|
|


|
1992-1997
|
1997-2001
|
|
|
|
| Con |
-13.31% |
| Lab |
9.05% |
| LD |
1.17% |
|
| Con |
-0.53% |
| Lab |
0.80% |
| LD |
2.86% |
|
|
|
Anthony Colman
Labour hold
|
| Con |
 |
13,140 |
38.36% |
| Lab |
 |
15,911 |
46.45% |
| LD |
 |
4,671 |
13.64% |
| Oth |
 |
532 |
1.55% |
| Maj |
 |
2,771 |
8.09% |
| Turn |
|
34,254 |
56.48% |
|
|
|
Anthony Colman
Labour hold
|
| LD |
Tony Burrett |
4,671 |
13.64% |
| L |
Anthony Colman |
15,911 |
46.45% |
| C |
Michael Simpson |
13,140 |
38.36% |
| UK |
Pat Wild |
347 |
1.01% |
| P |
Yvonne Windsor |
185 |
0.54% |
|
Candidates representing 5 parties stood for election to this seat.
|
|
|
Anthony Colman
Labour gain
|
| Con |
|
17,108 |
38.89% |
| Lab |
|
20,084 |
45.65% |
| LD |
|
4,739 |
10.77% |
| Ref |
 |
1,518 |
3.45% |
| Oth |
|
546 |
1.24% |
| Maj |
|
2,976 |
6.76% |
| Turn |
|
43,995 |
73.11% |
|
|
|
|
Conservative
|
| Con |
|
25,188 |
52.20% |
| Lab |
|
17,662 |
36.60% |
| LD |
|
4,636 |
9.60% |
| Oth |
|
757 |
1.60% |
| Maj |
|
7,526 |
15.60% |
| Turn |
|
48,243 |
77.96% |
|
|
|
|
|