|
Rayleigh
Conservative hold

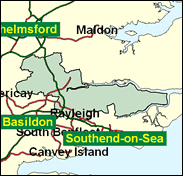
South East Essex has for some decades recorded the highest percentages of owner occupied housing anywhere in Britain in the decennial Census, and the seat with the highest of all, 90pc bar a tenth of a percentage point in 1991, is Rayleigh. This was a new constituency name in 1997, reflecting the recent population growth. It consists of a number of modern communities north west of Southend on Sea, such as Rayleigh itself, Hockley, Hawkwood and Hullbridge up towards the river Crouch. It stretches across the Crouch to a place which typifies this areas growth: South Woodham Ferrers. For example according to the last Census one of its wards, South woodham Ferrers Collingwood East and West (yes, that is one ward name) grew from 200 to 7,546 in ten years - a rise of 3,773 pc! Overall, Rayleigh is not an upper class seat. The proportion of residents with higher academic or professional qualifications is lower than the national average, as is that of those in higher management. Nevertheless, the Conservative majority over Labour even in 1997 was 10,684. It should be remembered too that it is 99pc white, has less than 5pc council tenants, and who can forget all those owner occupiers?

Mark Francois, former Director of the lobbyist firm Market Access, chubby-faced and Essex-reared, was born in 1965, attended Nicholas School, Basildon, Bristol University and King's College London. Battle-hardened, he served for four years on Basildon Council in the early nineties, fought Ken Livingstone at Brent East in 1997, and narrowly missed selection for the Kensington & Chelsea byelection fought by Michael Portillo, in 1999, and for East Devon in 2000. As a former student of war studies at King's College London, he has been active in the TA with the King's Anglian Regiment.
 |
| Wealthy Achievers, Suburban Areas |
30.50% |
14.99% |
203.44 |
|
| Affluent Greys, Rural Communities |
0.34% |
2.13% |
16.19 |
|
| Prosperous Pensioners, Retirement Areas |
2.31% |
2.49% |
93.10 |
|
| Affluent Executives, Family Areas |
14.02% |
4.43% |
316.93 |
|
| Well-Off Workers, Family Areas |
16.24% |
7.27% |
223.25 |
|
| Affluent Urbanites, Town & City Areas |
0.61% |
2.56% |
23.82 |
|
| Prosperous Professionals, Metropolitan Areas |
0.06% |
2.04% |
3.10 |
|
| Better-Off Executives, Inner City Areas |
0.02% |
3.94% |
0.48 |
|
| Comfortable Middle Agers, Mature Home Owning Areas |
29.83% |
13.04% |
228.74 |
|
| Skilled Workers, Home Owning Areas |
0.54% |
12.70% |
4.23 |
|
| New Home Owners, Mature Communities |
3.09% |
8.14% |
37.99 |
|
| White Collar Workers, Better-Off Multi Ethnic Areas |
0.00% |
4.02% |
0.00 |
|
| Older People, Less Prosperous Areas |
0.04% |
3.19% |
1.22 |
|
| Council Estate Residents, Better-Off Homes |
1.47% |
11.31% |
12.96 |
|
| Council Estate Residents, High Unemployment |
0.08% |
3.06% |
2.58 |
|
| Council Estate Residents, Greatest Hardship |
0.42% |
2.52% |
16.49 |
|
| People in Multi-Ethnic, Low-Income Areas |
0.00% |
2.10% |
0.00 |
|
| Unclassified |
0.43% |
0.06% |
684.15 |
|
|
 |
 |
 |
| £0-5K |
5.00% |
9.41% |
53.10 |
|
| £5-10K |
10.84% |
16.63% |
65.18 |
|
| £10-15K |
13.16% |
16.58% |
79.35 |
|
| £15-20K |
12.70% |
13.58% |
93.47 |
|
| £20-25K |
11.08% |
10.39% |
106.59 |
|
| £25-30K |
9.20% |
7.77% |
118.32 |
|
| £30-35K |
7.45% |
5.79% |
128.59 |
|
| £35-40K |
5.96% |
4.33% |
137.45 |
|
| £40-45K |
4.73% |
3.27% |
145.01 |
|
| £45-50K |
3.76% |
2.48% |
151.41 |
|
| £50-55K |
2.99% |
1.90% |
156.82 |
|
| £55-60K |
2.38% |
1.47% |
161.35 |
|
| £60-65K |
1.90% |
1.15% |
165.15 |
|
| £65-70K |
1.53% |
0.91% |
168.31 |
|
| £70-75K |
1.23% |
0.72% |
170.94 |
|
| £75-80K |
1.00% |
0.57% |
173.11 |
|
| £80-85K |
0.81% |
0.46% |
174.88 |
|
| £85-90K |
0.66% |
0.37% |
176.33 |
|
| £90-95K |
0.54% |
0.31% |
177.49 |
|
| £95-100K |
0.45% |
0.25% |
178.41 |
|
| £100K + |
2.41% |
1.34% |
179.00 |
|
|
|

|


|
1992-1997
|
1997-2001
|
|
|
|
| Con |
-11.37% |
| Lab |
14.10% |
| LD |
-2.15% |
|
| Con |
41.49% |
| Lab |
-23.49% |
| LD |
-17.03% |
|
|
 |
Mark Francois
Conservative hold
|
| Con |
 |
221,434 |
91.21% |
| Lab |
 |
13,144 |
5.41% |
| LD |
 |
6,614 |
2.72% |
| Oth |
 |
1,581 |
0.65% |
| Maj |
 |
208,290 |
85.80% |
| Turn |
 |
242,773 |
346.46% |
|
|
 |
Mark Francois
Conservative hold
|
| L |
Paul Clark |
13,144 |
5.41% |
| C |
Mark Francois |
221,434 |
91.21% |
| UK |
Colin Morgan |
1,581 |
0.65% |
| LD |
Geoff Williams |
6,614 |
2.72% |
|
Candidates representing 4 parties stood for election to this seat.
|
|
 |
Michael Clark
Conservative
|
| Con |
 |
25,516 |
49.73% |
| Lab |
 |
14,832 |
28.90% |
| LD |
 |
10,137 |
19.75% |
| Ref |
|
0 |
0.00% |
| Oth |
 |
829 |
1.62% |
| Maj |
 |
10,684 |
20.82% |
| Turn |
 |
51,314 |
74.65% |
|
|
 |
|
Conservative
|
| Con |
 |
33,065 |
61.10% |
| Lab |
 |
8,032 |
14.80% |
| LD |
 |
11,868 |
21.90% |
| Oth |
 |
1,152 |
2.10% |
| Maj |
 |
25,033 |
39.20% |
| Turn |
 |
54,117 |
80.52% |
|
|
 |
|

|

