|
Bethnal Green & Bow
Labour hold

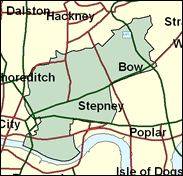
This seat in the heart of the east end of London looks like a Labour stronghold, but it produced one of the oddest - though little noticed - results in 1997 when there was actually a swing to the Conservatives of more than 5pc. How did this happen? The main issue concerned Labour's choice for this apparently plum redrawn seat. Oona King, a 29-year-old woman with a mixed ethnic background - her father a black American, her mother Jewish - did not appeal to many traditional Labour voters. The Conservative Dr Kabir Choudury, on the other hand, was the founder director-general of the Bangladesh Chamber of Commerce and had a strong local power base to work from. However, Ms King pulled through with an 11,000 majority and her high media profile may well ensure a smoother run this time around.

Oona King - one of Labour's ten non-white MPs, brings to the Commons a café-au-lait complexion and sexual chemistry born of the multi-cultural union between her African-American civil rights emigre father Professor Preston King, and her Jewish-Geordie mother, Hazel Stern - a melange at variance with the Bengali origins of most of her non-white constituents. With a singular extemporaneous oratorical style, accompanied by gentle swaying, she was born in 1967, educated at Haverstock School, Hampstead and York University, before working for Labour MEPs, including Glenys Kinnock. A backer of PR, and dubbed Labour's answer to Whoopi Goldberg, she is tenacious, talented, sharp and tough, as well as exuding immense charm, and must be counted the sexiest woman in the House of Commons.
 |
| Wealthy Achievers, Suburban Areas |
0.00% |
14.99% |
0.00 |
|
| Affluent Greys, Rural Communities |
0.00% |
2.13% |
0.00 |
|
| Prosperous Pensioners, Retirement Areas |
0.06% |
2.49% |
2.27 |
|
| Affluent Executives, Family Areas |
0.00% |
4.43% |
0.00 |
|
| Well-Off Workers, Family Areas |
0.00% |
7.27% |
0.00 |
|
| Affluent Urbanites, Town & City Areas |
2.73% |
2.56% |
106.63 |
|
| Prosperous Professionals, Metropolitan Areas |
3.46% |
2.04% |
169.44 |
|
| Better-Off Executives, Inner City Areas |
10.56% |
3.94% |
267.89 |
|
| Comfortable Middle Agers, Mature Home Owning Areas |
0.29% |
13.04% |
2.23 |
|
| Skilled Workers, Home Owning Areas |
0.00% |
12.70% |
0.00 |
|
| New Home Owners, Mature Communities |
0.00% |
8.14% |
0.00 |
|
| White Collar Workers, Better-Off Multi Ethnic Areas |
7.74% |
4.02% |
192.34 |
|
| Older People, Less Prosperous Areas |
0.00% |
3.19% |
0.00 |
|
| Council Estate Residents, Better-Off Homes |
3.60% |
11.31% |
31.79 |
|
| Council Estate Residents, High Unemployment |
26.64% |
3.06% |
869.88 |
|
| Council Estate Residents, Greatest Hardship |
0.29% |
2.52% |
11.47 |
|
| People in Multi-Ethnic, Low-Income Areas |
44.61% |
2.10% |
2,124.34 |
|
| Unclassified |
0.03% |
0.06% |
42.40 |
|
|
 |
 |
 |
| £0-5K |
7.95% |
9.41% |
84.40 |
|
| £5-10K |
13.48% |
16.63% |
81.07 |
|
| £10-15K |
14.22% |
16.58% |
85.79 |
|
| £15-20K |
12.53% |
13.58% |
92.23 |
|
| £20-25K |
10.27% |
10.39% |
98.82 |
|
| £25-30K |
8.17% |
7.77% |
105.05 |
|
| £30-35K |
6.42% |
5.79% |
110.76 |
|
| £35-40K |
5.02% |
4.33% |
115.90 |
|
| £40-45K |
3.93% |
3.27% |
120.51 |
|
| £45-50K |
3.09% |
2.48% |
124.62 |
|
| £50-55K |
2.44% |
1.90% |
128.30 |
|
| £55-60K |
1.94% |
1.47% |
131.59 |
|
| £60-65K |
1.55% |
1.15% |
134.55 |
|
| £65-70K |
1.24% |
0.91% |
137.20 |
|
| £70-75K |
1.00% |
0.72% |
139.60 |
|
| £75-80K |
0.81% |
0.57% |
141.76 |
|
| £80-85K |
0.66% |
0.46% |
143.72 |
|
| £85-90K |
0.55% |
0.37% |
145.51 |
|
| £90-95K |
0.45% |
0.31% |
147.13 |
|
| £95-100K |
0.37% |
0.25% |
148.61 |
|
| £100K + |
2.08% |
1.34% |
155.03 |
|
|
|

|


|
1992-1997
|
1997-2001
|
|
|
|
| Con |
4.66% |
| Lab |
-7.18% |
| LD |
-13.80% |
|
| Con |
3.17% |
| Lab |
4.06% |
| LD |
3.46% |
|
|
 |
Oona King
Labour hold
|
| Con |
 |
9,323 |
24.23% |
| Lab |
 |
19,380 |
50.38% |
| LD |
 |
5,946 |
15.46% |
| Oth |
 |
3,821 |
9.93% |
| Maj |
 |
10,057 |
26.14% |
| Turn |
 |
38,470 |
48.58% |
|
|
 |
Oona King
Labour hold
|
| G |
Anna Bragga |
1,666 |
4.33% |
| BNP |
Michael Davidson |
1,267 |
3.29% |
| NBP |
Dennis Delderfield |
888 |
2.31% |
| C |
Shahagir Faruk |
9,323 |
24.23% |
| L |
Oona King |
19,380 |
50.38% |
| LD |
Janet Ludlow |
5,946 |
15.46% |
|
Candidates representing 6 parties stood for election to this seat.
|
|
 |
Oona King
Labour
|
| Con |
 |
9,412 |
21.06% |
| Lab |
 |
20,697 |
46.32% |
| LD |
 |
5,361 |
12.00% |
| Ref |
 |
557 |
1.25% |
| Oth |
 |
8,655 |
19.37% |
| Maj |
 |
11,285 |
25.26% |
| Turn |
 |
44,682 |
61.20% |
|
|
 |
|
Labour
|
| Con |
 |
7,316 |
16.40% |
| Lab |
 |
23,863 |
53.50% |
| LD |
 |
11,498 |
25.80% |
| Oth |
 |
1,918 |
4.30% |
| Maj |
 |
12,365 |
27.70% |
| Turn |
 |
44,595 |
68.10% |
|
|
 |
|

|

