|
Reading East
Labour hold

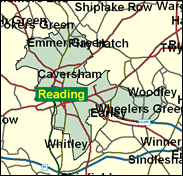
Be ready for two very tough battles in the critical marginal Reading seats at the next General Election. In East, which would be vulnerable to a swing of just under four pc, Jane Griffiths is up against Barry Tanswell, and should be ahead in the eight Reading wards in the seat, but she will struggle in the four suburban Woodley wards, and overall will be fortunate to obtain a second term. Labour can win a second term nationally without her, but their overall majority would probably be reduced below 100.

Jane Griffiths, a former Caversham-based BBC translator, was surprisingly elected here for Labour in 1997. Born 1954 and educated at Cedars Grammar School, Leighton Buzzard and Durham University, she rose politically as a Reading councillor. She has protested at Tory MPs' sexism, campaigned on prostate cancer, and called for a discouragement of new jobs in the overheated Thames Valley in order to ease pressure on housing. Her Conservative challenger, Barry Tanswell, is Marks & Spencers' regional manager in Oxfordshire, born 1958 and educated at Devizes Comprehensive. In 1997 he was campaign director in Witney for the subsequently floor-crossing Shaun Woodward, and oddly dubs himself a "turquoise Tory".
 |
| Wealthy Achievers, Suburban Areas |
18.63% |
14.99% |
124.27 |
|
| Affluent Greys, Rural Communities |
0.00% |
2.13% |
0.00 |
|
| Prosperous Pensioners, Retirement Areas |
1.35% |
2.49% |
54.46 |
|
| Affluent Executives, Family Areas |
3.27% |
4.43% |
73.89 |
|
| Well-Off Workers, Family Areas |
12.86% |
7.27% |
176.76 |
|
| Affluent Urbanites, Town & City Areas |
11.43% |
2.56% |
445.87 |
|
| Prosperous Professionals, Metropolitan Areas |
4.93% |
2.04% |
241.65 |
|
| Better-Off Executives, Inner City Areas |
12.45% |
3.94% |
315.63 |
|
| Comfortable Middle Agers, Mature Home Owning Areas |
8.22% |
13.04% |
63.06 |
|
| Skilled Workers, Home Owning Areas |
6.99% |
12.70% |
55.00 |
|
| New Home Owners, Mature Communities |
2.80% |
8.14% |
34.36 |
|
| White Collar Workers, Better-Off Multi Ethnic Areas |
8.75% |
4.02% |
217.69 |
|
| Older People, Less Prosperous Areas |
0.46% |
3.19% |
14.55 |
|
| Council Estate Residents, Better-Off Homes |
4.58% |
11.31% |
40.50 |
|
| Council Estate Residents, High Unemployment |
1.69% |
3.06% |
55.33 |
|
| Council Estate Residents, Greatest Hardship |
1.05% |
2.52% |
41.63 |
|
| People in Multi-Ethnic, Low-Income Areas |
0.50% |
2.10% |
23.63 |
|
| Unclassified |
0.03% |
0.06% |
43.29 |
|
|
 |
 |
 |
| £0-5K |
5.60% |
9.41% |
59.51 |
|
| £5-10K |
11.29% |
16.63% |
67.85 |
|
| £10-15K |
13.35% |
16.58% |
80.50 |
|
| £15-20K |
12.69% |
13.58% |
93.45 |
|
| £20-25K |
10.96% |
10.39% |
105.47 |
|
| £25-30K |
9.03% |
7.77% |
116.17 |
|
| £30-35K |
7.27% |
5.79% |
125.49 |
|
| £35-40K |
5.79% |
4.33% |
133.52 |
|
| £40-45K |
4.58% |
3.27% |
140.40 |
|
| £45-50K |
3.63% |
2.48% |
146.27 |
|
| £50-55K |
2.88% |
1.90% |
151.29 |
|
| £55-60K |
2.29% |
1.47% |
155.58 |
|
| £60-65K |
1.83% |
1.15% |
159.25 |
|
| £65-70K |
1.47% |
0.91% |
162.40 |
|
| £70-75K |
1.19% |
0.72% |
165.12 |
|
| £75-80K |
0.96% |
0.57% |
167.47 |
|
| £80-85K |
0.78% |
0.46% |
169.51 |
|
| £85-90K |
0.64% |
0.37% |
171.28 |
|
| £90-95K |
0.53% |
0.31% |
172.83 |
|
| £95-100K |
0.44% |
0.25% |
174.18 |
|
| £100K + |
2.41% |
1.34% |
179.26 |
|
|
|

|


|
1992-1997
|
1997-2001
|
|
|
|
| Con |
-13.92% |
| Lab |
13.83% |
| LD |
-1.87% |
|
| Con |
-3.21% |
| Lab |
2.04% |
| LD |
-0.01% |
|
|
 |
Jane Griffiths
Labour hold
|
| Con |
 |
13,943 |
31.97% |
| Lab |
 |
19,531 |
44.78% |
| LD |
 |
8,078 |
18.52% |
| Oth |
 |
2,066 |
4.74% |
| Maj |
 |
5,588 |
12.81% |
| Turn |
 |
43,618 |
58.44% |
|
|
 |
Jane Griffiths
Labour hold
|
| LD |
Tom Dobrashian |
8,078 |
18.52% |
| L |
Jane Griffiths |
19,531 |
44.78% |
| I |
Peter Hammerson |
94 |
0.22% |
| G |
Miriam Kennett |
1,053 |
2.41% |
| C |
Barry Tanswell |
13,943 |
31.97% |
| UK |
Amy Thornton |
525 |
1.20% |
| SA |
Darren Williams |
394 |
0.90% |
|
Candidates representing 7 parties stood for election to this seat.
|
|
 |
Jane Griffiths
Labour gain
|
| Con |
 |
17,666 |
35.18% |
| Lab |
 |
21,461 |
42.73% |
| LD |
 |
9,307 |
18.53% |
| Ref |
 |
1,042 |
2.07% |
| Oth |
 |
744 |
1.48% |
| Maj |
 |
3,795 |
7.56% |
| Turn |
 |
50,220 |
70.15% |
|
|
 |
|
Conservative
|
| Con |
 |
25,699 |
49.10% |
| Lab |
 |
15,115 |
28.90% |
| LD |
 |
10,684 |
20.40% |
| Oth |
 |
814 |
1.60% |
| Maj |
 |
10,584 |
20.20% |
| Turn |
 |
52,312 |
74.93% |
|
|
 |
|

|

