|
Redditch
Labour hold

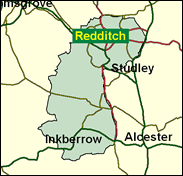
Redditch has all the hallmarks of a desperately close battle at the next General Election. In the Borough council contests in May 1999 Labour were 8pc ahead, in an unusually good midterm year, and in May 2000 the Tories reversed the position, coming out 12pc ahead. In the 1997 General Election, the first at which this West Midlands seat centred on the Worcestershire 'expanded New Town' was contested, Jacqui Smith won for Labour by a margin of 13pc, exactly the same as their lead in the country as a whole. Most of the neighbourhoods within the town are also closely fought. It is places like this, not more glamorous and better known parts of the country, that will decide the next government of the United Kingdom.

Jacqui Smith. a junior Education Minister (responsible for schools) since 1999, was elected here in 1997, following selection from an all-women shortlist. With a fairly standard Labour pedigree as a teacher and local councillor, she had the additional experience as researcher for Terry Davis MP, who had represented the area in the seventies. Born 1962 in London, as reflected in her speech, she was educated at Perrins High School, Malvern and Hertford College, Oxford. A wholly on-message Blairite, she is one of a handful of the 1997 intake of women to have babies since the election, followed, in her case, a year later by deployment of her combative demeanour as a minister.
 |
| Wealthy Achievers, Suburban Areas |
10.88% |
14.99% |
72.56 |
|
| Affluent Greys, Rural Communities |
0.00% |
2.13% |
0.00 |
|
| Prosperous Pensioners, Retirement Areas |
0.37% |
2.49% |
14.99 |
|
| Affluent Executives, Family Areas |
17.08% |
4.43% |
386.09 |
|
| Well-Off Workers, Family Areas |
16.78% |
7.27% |
230.76 |
|
| Affluent Urbanites, Town & City Areas |
0.46% |
2.56% |
18.04 |
|
| Prosperous Professionals, Metropolitan Areas |
0.00% |
2.04% |
0.00 |
|
| Better-Off Executives, Inner City Areas |
0.24% |
3.94% |
5.99 |
|
| Comfortable Middle Agers, Mature Home Owning Areas |
5.47% |
13.04% |
41.94 |
|
| Skilled Workers, Home Owning Areas |
6.25% |
12.70% |
49.18 |
|
| New Home Owners, Mature Communities |
5.52% |
8.14% |
67.81 |
|
| White Collar Workers, Better-Off Multi Ethnic Areas |
0.23% |
4.02% |
5.81 |
|
| Older People, Less Prosperous Areas |
3.04% |
3.19% |
95.51 |
|
| Council Estate Residents, Better-Off Homes |
29.25% |
11.31% |
258.60 |
|
| Council Estate Residents, High Unemployment |
1.87% |
3.06% |
61.23 |
|
| Council Estate Residents, Greatest Hardship |
2.54% |
2.52% |
100.87 |
|
| People in Multi-Ethnic, Low-Income Areas |
0.00% |
2.10% |
0.00 |
|
| Unclassified |
0.00% |
0.06% |
0.00 |
|
|
 |
 |
 |
| £0-5K |
8.54% |
9.41% |
90.76 |
|
| £5-10K |
15.82% |
16.63% |
95.11 |
|
| £10-15K |
16.44% |
16.58% |
99.19 |
|
| £15-20K |
13.81% |
13.58% |
101.70 |
|
| £20-25K |
10.71% |
10.39% |
103.01 |
|
| £25-30K |
8.05% |
7.77% |
103.53 |
|
| £30-35K |
6.00% |
5.79% |
103.55 |
|
| £35-40K |
4.47% |
4.33% |
103.27 |
|
| £40-45K |
3.36% |
3.27% |
102.81 |
|
| £45-50K |
2.54% |
2.48% |
102.25 |
|
| £50-55K |
1.94% |
1.90% |
101.63 |
|
| £55-60K |
1.49% |
1.47% |
101.00 |
|
| £60-65K |
1.16% |
1.15% |
100.36 |
|
| £65-70K |
0.90% |
0.91% |
99.73 |
|
| £70-75K |
0.71% |
0.72% |
99.11 |
|
| £75-80K |
0.57% |
0.57% |
98.52 |
|
| £80-85K |
0.45% |
0.46% |
97.94 |
|
| £85-90K |
0.36% |
0.37% |
97.39 |
|
| £90-95K |
0.30% |
0.31% |
96.86 |
|
| £95-100K |
0.24% |
0.25% |
96.35 |
|
| £100K + |
1.26% |
1.34% |
93.52 |
|
|
|

|


|
1992-1997
|
1997-2001
|
|
|
|
| Con |
-11.00% |
| Lab |
9.39% |
| LD |
-0.67% |
|
| Con |
2.82% |
| Lab |
-4.16% |
| LD |
-0.75% |
|
|
 |
Jacqui Smith
Labour hold
|
| Con |
 |
14,415 |
38.93% |
| Lab |
 |
16,899 |
45.63% |
| LD |
 |
3,808 |
10.28% |
| Oth |
 |
1,910 |
5.16% |
| Maj |
 |
2,484 |
6.71% |
| Turn |
 |
37,032 |
59.21% |
|
|
 |
Jacqui Smith
Labour hold
|
| G |
Richard Armstrong |
651 |
1.76% |
| LD |
Michael Ashall |
3,808 |
10.28% |
| UK |
George Flynn |
1,259 |
3.40% |
| C |
Karan Lumley |
14,415 |
38.93% |
| L |
Jacqui Smith |
16,899 |
45.63% |
|
Candidates representing 5 parties stood for election to this seat.
|
|
 |
Jacqui Smith
Labour gain
|
| Con |
 |
16,155 |
36.10% |
| Lab |
 |
22,280 |
49.79% |
| LD |
 |
4,935 |
11.03% |
| Ref |
 |
1,151 |
2.57% |
| Oth |
 |
227 |
0.51% |
| Maj |
 |
6,125 |
13.69% |
| Turn |
 |
44,748 |
73.55% |
|
|
 |
|
Conservative
|
| Con |
 |
22,930 |
47.10% |
| Lab |
 |
19,643 |
40.40% |
| LD |
 |
5,716 |
11.70% |
| Oth |
 |
384 |
0.80% |
| Maj |
 |
3,287 |
6.80% |
| Turn |
 |
48,673 |
80.86% |
|
|
 |
|

|

