|
Regent's Park & Kensington North
Labour hold

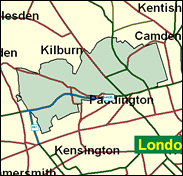
Apparently a seat almost drawn for Labour, crossing the borough boundaries between Westminster and Kensington to include the more working class and mixed ethnicity areas of Queen's Park and Harrow Road in the former and North Kensington (sometimes rather incompletely and misleadingly called Notting Hill - it is the section of the carnival, not the feature film, which is included here) in the latter. It is scarcely surprising that Karen Buck won this constituency by over 14,500 when it was first fought in 1997, but it must in the long term be vulnerable to major boundary changes as the borough of Westminster, for example, is provisionally recommended to be paired with Brent in the next review.

Karen Buck, a Labour Party staffer for 10 years before winning this seat in 1997, and one of a clutch of new Labour MPs who as Westminster councillors publicised the alleged "homes for votes" affair under the Conservative leadership of Dame Shirley Porter, has made less of a mark in the Commons than might have been expected, and certainly less than fellow former Westminster councillors, Andrew Dismore and Peter Bradley. She was born in 1958 and educated at Chelmsford County High School for Girls and the LSE. Her career appeared to peak before 1997 in another respect: she was the last woman to be picked from an all-women shortlist, her selection being the cause of a complaint which led in 1996 to the suspension of the practice.
 |
| Wealthy Achievers, Suburban Areas |
0.00% |
14.99% |
0.02 |
|
| Affluent Greys, Rural Communities |
0.00% |
2.13% |
0.00 |
|
| Prosperous Pensioners, Retirement Areas |
2.20% |
2.49% |
88.43 |
|
| Affluent Executives, Family Areas |
0.05% |
4.43% |
1.13 |
|
| Well-Off Workers, Family Areas |
0.16% |
7.27% |
2.26 |
|
| Affluent Urbanites, Town & City Areas |
4.21% |
2.56% |
164.11 |
|
| Prosperous Professionals, Metropolitan Areas |
10.67% |
2.04% |
522.85 |
|
| Better-Off Executives, Inner City Areas |
44.97% |
3.94% |
1,140.25 |
|
| Comfortable Middle Agers, Mature Home Owning Areas |
0.04% |
13.04% |
0.30 |
|
| Skilled Workers, Home Owning Areas |
0.00% |
12.70% |
0.00 |
|
| New Home Owners, Mature Communities |
0.00% |
8.14% |
0.00 |
|
| White Collar Workers, Better-Off Multi Ethnic Areas |
2.30% |
4.02% |
57.10 |
|
| Older People, Less Prosperous Areas |
0.00% |
3.19% |
0.00 |
|
| Council Estate Residents, Better-Off Homes |
1.18% |
11.31% |
10.45 |
|
| Council Estate Residents, High Unemployment |
13.71% |
3.06% |
447.79 |
|
| Council Estate Residents, Greatest Hardship |
0.27% |
2.52% |
10.73 |
|
| People in Multi-Ethnic, Low-Income Areas |
20.13% |
2.10% |
958.65 |
|
| Unclassified |
0.10% |
0.06% |
167.76 |
|
|
 |
 |
 |
| £0-5K |
7.45% |
9.41% |
79.18 |
|
| £5-10K |
12.27% |
16.63% |
73.76 |
|
| £10-15K |
12.95% |
16.58% |
78.09 |
|
| £15-20K |
11.61% |
13.58% |
85.46 |
|
| £20-25K |
9.79% |
10.39% |
94.19 |
|
| £25-30K |
8.06% |
7.77% |
103.62 |
|
| £30-35K |
6.57% |
5.79% |
113.38 |
|
| £35-40K |
5.34% |
4.33% |
123.25 |
|
| £40-45K |
4.35% |
3.27% |
133.10 |
|
| £45-50K |
3.55% |
2.48% |
142.84 |
|
| £50-55K |
2.90% |
1.90% |
152.40 |
|
| £55-60K |
2.38% |
1.47% |
161.75 |
|
| £60-65K |
1.97% |
1.15% |
170.86 |
|
| £65-70K |
1.63% |
0.91% |
179.71 |
|
| £70-75K |
1.35% |
0.72% |
188.30 |
|
| £75-80K |
1.13% |
0.57% |
196.63 |
|
| £80-85K |
0.95% |
0.46% |
204.70 |
|
| £85-90K |
0.80% |
0.37% |
212.50 |
|
| £90-95K |
0.67% |
0.31% |
220.05 |
|
| £95-100K |
0.57% |
0.25% |
227.35 |
|
| £100K + |
3.63% |
1.34% |
269.92 |
|
|
|

|


|
1992-1997
|
1997-2001
|
|
|
|
| Con |
-12.14% |
| Lab |
11.62% |
| LD |
0.64% |
|
| Con |
-2.02% |
| Lab |
-5.27% |
| LD |
4.07% |
|
|
 |
Karen Buck
Labour hold
|
| Con |
 |
9,981 |
26.94% |
| Lab |
 |
20,247 |
54.64% |
| LD |
 |
4,669 |
12.60% |
| Oth |
 |
2,155 |
5.82% |
| Maj |
 |
10,266 |
27.71% |
| Turn |
 |
37,052 |
48.83% |
|
|
 |
Karen Buck
Labour hold
|
| LD |
David Boyle |
4,669 |
12.60% |
| L |
Karen Buck |
20,247 |
54.64% |
| UK |
Alan Crisp |
354 |
0.96% |
| SA |
China Mieville |
459 |
1.24% |
| G |
Paul Miller |
1,268 |
3.42% |
| I |
Charlotte Regan |
74 |
0.20% |
| C |
Peter Wilson |
9,981 |
26.94% |
|
Candidates representing 7 parties stood for election to this seat.
|
|
 |
Karen Buck
Labour
|
| Con |
 |
13,710 |
28.96% |
| Lab |
 |
28,367 |
59.92% |
| LD |
 |
4,041 |
8.54% |
| Ref |
 |
867 |
1.83% |
| Oth |
 |
359 |
0.76% |
| Maj |
 |
14,657 |
30.96% |
| Turn |
 |
47,344 |
64.19% |
|
|
 |
|
Labour
|
| Con |
 |
21,503 |
41.10% |
| Lab |
 |
25,317 |
48.30% |
| LD |
 |
4,163 |
7.90% |
| Oth |
 |
1,385 |
2.60% |
| Maj |
 |
3,814 |
7.30% |
| Turn |
 |
52,368 |
74.86% |
|
|
 |
|

|

