|
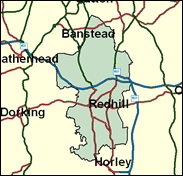
Reigate
Conservative hold

The safety of this mid Surrey seat for the Conservatives could not have been better demonstrated than in 1997. In a year of general disaster for them, they were further plagued here by the candidature of the sitting MP, Sir George Gardiner, who had defected to the Referendum party (after a spell of deprivation of the Tory whip for rebellion against the Maastricht treaty). Fears that he would split their vote were to some extent justified, as he saved his deposit with a 7pc share. Labour did advance by 10pc too, but Crispin Blunt withstood all this trouble to take his place in the Commons with a majority of nearly 8,000. He can assume that this is likely to increase under at least slightly easier circumstances in the forthcoming general election.

Crispin Blunt won Reigate in 1997 as replacement for the expelled Sir George Gardiner. Son of a general, and a former captain (for 11 years) in the Royal Hussars, he was born in 1960 and educated at the military public school, Wellington, as a prelude to nearby Sandhurst, and Durham University. A former adviser both as Defence and Foreign minister of Sir Malcolm Rifkind, he followed Rifkind's journey from pro-European to Eurosceptic, favouring "a Europe of nation states" and opposing the Amsterdam Treaty. Seen by some as patronising, he lives up to both his names as both 'crisp' and 'blunt', though the nickname of 'Crippen' is said to be a joke.
 |
| Wealthy Achievers, Suburban Areas |
41.27% |
14.99% |
275.24 |
|
| Affluent Greys, Rural Communities |
0.05% |
2.13% |
2.15 |
|
| Prosperous Pensioners, Retirement Areas |
2.28% |
2.49% |
91.62 |
|
| Affluent Executives, Family Areas |
1.53% |
4.43% |
34.49 |
|
| Well-Off Workers, Family Areas |
10.79% |
7.27% |
148.29 |
|
| Affluent Urbanites, Town & City Areas |
3.85% |
2.56% |
150.16 |
|
| Prosperous Professionals, Metropolitan Areas |
4.08% |
2.04% |
199.68 |
|
| Better-Off Executives, Inner City Areas |
0.76% |
3.94% |
19.23 |
|
| Comfortable Middle Agers, Mature Home Owning Areas |
20.34% |
13.04% |
156.02 |
|
| Skilled Workers, Home Owning Areas |
3.51% |
12.70% |
27.66 |
|
| New Home Owners, Mature Communities |
6.73% |
8.14% |
82.59 |
|
| White Collar Workers, Better-Off Multi Ethnic Areas |
0.78% |
4.02% |
19.29 |
|
| Older People, Less Prosperous Areas |
1.03% |
3.19% |
32.37 |
|
| Council Estate Residents, Better-Off Homes |
2.06% |
11.31% |
18.24 |
|
| Council Estate Residents, High Unemployment |
0.88% |
3.06% |
28.72 |
|
| Council Estate Residents, Greatest Hardship |
0.00% |
2.52% |
0.00 |
|
| People in Multi-Ethnic, Low-Income Areas |
0.00% |
2.10% |
0.00 |
|
| Unclassified |
0.08% |
0.06% |
128.08 |
|
|
 |
 |
 |
| £0-5K |
4.06% |
9.41% |
43.09 |
|
| £5-10K |
9.03% |
16.63% |
54.30 |
|
| £10-15K |
11.49% |
16.58% |
69.32 |
|
| £15-20K |
11.63% |
13.58% |
85.65 |
|
| £20-25K |
10.61% |
10.39% |
102.08 |
|
| £25-30K |
9.17% |
7.77% |
118.00 |
|
| £30-35K |
7.71% |
5.79% |
133.06 |
|
| £35-40K |
6.37% |
4.33% |
147.11 |
|
| £40-45K |
5.23% |
3.27% |
160.08 |
|
| £45-50K |
4.27% |
2.48% |
171.98 |
|
| £50-55K |
3.48% |
1.90% |
182.85 |
|
| £55-60K |
2.84% |
1.47% |
192.74 |
|
| £60-65K |
2.32% |
1.15% |
201.71 |
|
| £65-70K |
1.90% |
0.91% |
209.84 |
|
| £70-75K |
1.56% |
0.72% |
217.19 |
|
| £75-80K |
1.29% |
0.57% |
223.84 |
|
| £80-85K |
1.06% |
0.46% |
229.83 |
|
| £85-90K |
0.88% |
0.37% |
235.24 |
|
| £90-95K |
0.73% |
0.31% |
240.11 |
|
| £95-100K |
0.61% |
0.25% |
244.48 |
|
| £100K + |
3.50% |
1.34% |
260.64 |
|
|
|

|


|
1992-1997
|
1997-2001
|
|
|
|
| Con |
-13.65% |
| Lab |
10.28% |
| LD |
-4.14% |
|
| Con |
3.97% |
| Lab |
-0.29% |
| LD |
1.14% |
|
|
 |
Crispin Blunt
Conservative hold
|
| Con |
 |
18,875 |
47.82% |
| Lab |
 |
10,850 |
27.49% |
| LD |
 |
8,330 |
21.10% |
| Oth |
 |
1,419 |
3.59% |
| Maj |
 |
8,025 |
20.33% |
| Turn |
 |
39,474 |
60.71% |
|
|
 |
Crispin Blunt
Conservative hold
|
| C |
Crispin Blunt |
18,875 |
47.82% |
| L |
Simon Charleton |
10,850 |
27.49% |
| RUK |
Harold Green |
357 |
0.90% |
| LD |
Jane Kulka |
8,330 |
21.10% |
| UK |
Stephen Smith |
1,062 |
2.69% |
|
Candidates representing 5 parties stood for election to this seat.
|
|
 |
Crispin Blunt
Conservative
|
| Con |
 |
21,123 |
43.85% |
| Lab |
 |
13,382 |
27.78% |
| LD |
 |
9,615 |
19.96% |
| Ref |
 |
3,352 |
6.96% |
| Oth |
 |
702 |
1.46% |
| Maj |
 |
7,741 |
16.07% |
| Turn |
 |
48,174 |
74.40% |
|
|
 |
|
Conservative
|
| Con |
 |
29,148 |
57.50% |
| Lab |
 |
8,870 |
17.50% |
| LD |
 |
12,208 |
24.10% |
| Oth |
 |
441 |
0.90% |
| Maj |
 |
16,940 |
33.40% |
| Turn |
 |
50,667 |
78.79% |
|
|
 |
|

|

