|
Renfrewshire West
Labour hold

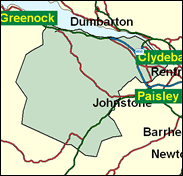
After the expulsion of Tommy Graham, the Labour MP elected in 1997 from his party, the apparently safe Labour seat of Renfrewshire West has seen elements of uncertainty encroach. It is most likely to pass to the new official Labour candidate James Sheridan. In the 1999 Scottish Parliament contest, for example, Labour held on by a perfectly average amount against the SNP. The Conservatives have a larger vote here than in most central Scotland seats, based on the substantial middle class presence in the desirable private residential areas of Bridge of Weir and Kilmacolm in the Gryffe valley, and the expanding semi-rural ward of Houston. If this seat were in England, these elements would guarantee marginal status at least. On the other hand, in 1997 Labour was greatly helped by the arrival in boundary changes of the tough working class industrial town of Port Glasgow, on the mouth of the Clyde as its name implies.

Jim Sheridan is Labour's new candidate here in place of Tommy Graham, who held the seat from 1987 but was expelled in 1998 after feuding inside the Labour Party in the Renfrewshire area and the allegedly linked suicide of Paisley South MP, Gordon McMaster. Labour's solution to this nasty internecine spat is to keep it local: Jim Sheridan, born 1952 and educated at St. Pius (RC) Secondary School, Glasgow, is a local Renfrewshire councillor (for Erskine) and Chairman of the West Renfrewshire CLP. A former material handler at Pilkington Optronics, he comes with (in his own words) "a long family history in the trade union and Labour movement", specifically with national prominence in the TGWU.
 |
| Wealthy Achievers, Suburban Areas |
10.98% |
14.99% |
73.21 |
|
| Affluent Greys, Rural Communities |
0.00% |
2.13% |
0.15 |
|
| Prosperous Pensioners, Retirement Areas |
0.53% |
2.49% |
21.42 |
|
| Affluent Executives, Family Areas |
15.62% |
4.43% |
353.02 |
|
| Well-Off Workers, Family Areas |
14.15% |
7.27% |
194.50 |
|
| Affluent Urbanites, Town & City Areas |
1.36% |
2.56% |
52.86 |
|
| Prosperous Professionals, Metropolitan Areas |
0.80% |
2.04% |
39.37 |
|
| Better-Off Executives, Inner City Areas |
0.98% |
3.94% |
24.97 |
|
| Comfortable Middle Agers, Mature Home Owning Areas |
4.25% |
13.04% |
32.58 |
|
| Skilled Workers, Home Owning Areas |
10.93% |
12.70% |
86.03 |
|
| New Home Owners, Mature Communities |
3.99% |
8.14% |
49.04 |
|
| White Collar Workers, Better-Off Multi Ethnic Areas |
1.60% |
4.02% |
39.88 |
|
| Older People, Less Prosperous Areas |
5.63% |
3.19% |
176.78 |
|
| Council Estate Residents, Better-Off Homes |
16.92% |
11.31% |
149.61 |
|
| Council Estate Residents, High Unemployment |
6.59% |
3.06% |
215.37 |
|
| Council Estate Residents, Greatest Hardship |
5.65% |
2.52% |
224.50 |
|
| People in Multi-Ethnic, Low-Income Areas |
0.00% |
2.10% |
0.00 |
|
| Unclassified |
0.00% |
0.06% |
0.00 |
|
|
 |
 |
 |
| £0-5K |
7.66% |
9.41% |
81.41 |
|
| £5-10K |
13.48% |
16.63% |
81.03 |
|
| £10-15K |
14.21% |
16.58% |
85.73 |
|
| £15-20K |
12.63% |
13.58% |
92.99 |
|
| £20-25K |
10.51% |
10.39% |
101.17 |
|
| £25-30K |
8.49% |
7.77% |
109.26 |
|
| £30-35K |
6.76% |
5.79% |
116.72 |
|
| £35-40K |
5.34% |
4.33% |
123.28 |
|
| £40-45K |
4.21% |
3.27% |
128.85 |
|
| £45-50K |
3.31% |
2.48% |
133.42 |
|
| £50-55K |
2.61% |
1.90% |
137.07 |
|
| £55-60K |
2.06% |
1.47% |
139.86 |
|
| £60-65K |
1.63% |
1.15% |
141.91 |
|
| £65-70K |
1.30% |
0.91% |
143.31 |
|
| £70-75K |
1.04% |
0.72% |
144.16 |
|
| £75-80K |
0.83% |
0.57% |
144.53 |
|
| £80-85K |
0.67% |
0.46% |
144.49 |
|
| £85-90K |
0.54% |
0.37% |
144.13 |
|
| £90-95K |
0.44% |
0.31% |
143.48 |
|
| £95-100K |
0.36% |
0.25% |
142.61 |
|
| £100K + |
1.78% |
1.34% |
132.24 |
|
|
|

|


|
1992-1997
|
1997-2001
|
|
|
|
| Con |
-9.23% |
| Lab |
3.66% |
| LD |
-0.75% |
| SNP |
5.91% |
|
| Con |
-2.08% |
| Lab |
0.37% |
| LD |
4.84% |
| SNP |
-5.18% |
|
|
 |
James Sheridan
Labour hold
|
| Con |
 |
5,522 |
16.49% |
| Lab |
 |
15,720 |
46.93% |
| LD |
 |
4,185 |
12.49% |
| SNP |
 |
7,145 |
21.33% |
| Oth |
 |
925 |
2.76% |
| Maj |
 |
8,575 |
25.60% |
| Turn |
 |
33,497 |
63.33% |
|
|
 |
James Sheridan
Labour hold
|
| LD |
Clare Hamblen |
4,185 |
12.49% |
| SSP |
Arlene Nunnery |
925 |
2.76% |
| SNP |
Carol Puthucheary |
7,145 |
21.33% |
| C |
David Sharpe |
5,522 |
16.49% |
| L |
James Sheridan |
15,720 |
46.93% |
|
Candidates representing 5 parties stood for election to this seat.
|
|
 |
Thomas Graham
Labour
|
| Con |
 |
7,387 |
18.57% |
| Lab |
 |
18,525 |
46.56% |
| LD |
 |
3,045 |
7.65% |
| SNP |
 |
10,546 |
26.51% |
| Ref |
 |
283 |
0.71% |
| Oth |
|
0 |
0.00% |
| Maj |
 |
7,979 |
20.05% |
| Turn |
 |
39,786 |
76.00% |
|
|
 |
|
Labour
|
| Con |
 |
11,128 |
27.80% |
| Lab |
 |
17,174 |
42.90% |
| LD |
 |
3,375 |
8.40% |
| SNP |
 |
8,258 |
20.60% |
| Oth |
 |
129 |
0.30% |
| Maj |
 |
6,046 |
15.10% |
| Turn |
 |
40,064 |
77.29% |
|
|
 |
|

|

