|
Rhondda
Labour hold

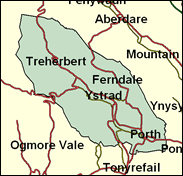
What on earth went on in this most quintessential of South Wales valleys in the Welsh assembly elections of May 1999? We know that Labour's candidate, the former MEP Wayne David, lost by over 2,000 to the Plaid Cymru's Geraint Davies. Certainly Labour's campaign had been damaged by the shenanigans surrounding the withdrawal of their first chosen candidate, Ron Davies, then the alleged imposition of the more malleable Alun Michael as a last minute choice by the London party headquarters as nominee for First Secretary in place of the independently minded Rhodri Morgan, who nevertheless ended up in the job. The turnout in Rhondda was only 35pc compared with over twice that in the 1997 General Election. But they achieved a mighty 74.5pc of the vote then, only 40pc two years later; that cannot be accounted for by turnout. Perhaps there was an element of complacency in the local organisation too, perhaps a distrust in this ancient citadel of socialism for new-fangled New Labour in government. It will be interesting to see how far a rather unusual candidate, Chris Bryant, manages to split the gap between the 1997 and 1999 performances.

Chris Bryant is an unusual replacement for Labour's retiring Allan Rogers here in Labour's oldest seat. A former Anglican priest, born (1962) into a Conservative family, he attended public school (Cheltenham) and Oxford (Mansfield College), and joined the Labour Party aged 24. He served as a curate in High Wycombe for 3 years, was a Labour agent for Frank Dobson in Holborn & St Pancras, and latterly worked as the BBC's Head of European Affairs. Tall, pallid and straight-faced, he is a former Chairman of the Christian Socialist Movement and author of various books on Christian socialism, Stafford Cripps, John Smith and Glenda Jackson. Targeted for his English origins , his homosexuality, and his Tory loyalties when an Oxford student, he faces the Welsh nationalist Leanne Wood, a social work lecturer at Cardiff University. She was born locally in 1971 and was educated at Tonypandy Comprehensive and Cardiff and Glamorgan Universities. Her English name and inability to speak Welsh could well - paradoxically - be what it takes to wrest this anglicised south Wales bastion from Labour.
 |
| Wealthy Achievers, Suburban Areas |
0.79% |
14.99% |
5.27 |
|
| Affluent Greys, Rural Communities |
0.00% |
2.13% |
0.00 |
|
| Prosperous Pensioners, Retirement Areas |
0.00% |
2.49% |
0.00 |
|
| Affluent Executives, Family Areas |
0.00% |
4.43% |
0.00 |
|
| Well-Off Workers, Family Areas |
0.71% |
7.27% |
9.73 |
|
| Affluent Urbanites, Town & City Areas |
0.00% |
2.56% |
0.00 |
|
| Prosperous Professionals, Metropolitan Areas |
0.00% |
2.04% |
0.00 |
|
| Better-Off Executives, Inner City Areas |
0.00% |
3.94% |
0.00 |
|
| Comfortable Middle Agers, Mature Home Owning Areas |
0.56% |
13.04% |
4.26 |
|
| Skilled Workers, Home Owning Areas |
82.18% |
12.70% |
646.98 |
|
| New Home Owners, Mature Communities |
4.10% |
8.14% |
50.38 |
|
| White Collar Workers, Better-Off Multi Ethnic Areas |
0.01% |
4.02% |
0.19 |
|
| Older People, Less Prosperous Areas |
2.41% |
3.19% |
75.50 |
|
| Council Estate Residents, Better-Off Homes |
4.50% |
11.31% |
39.82 |
|
| Council Estate Residents, High Unemployment |
0.20% |
3.06% |
6.68 |
|
| Council Estate Residents, Greatest Hardship |
4.53% |
2.52% |
179.96 |
|
| People in Multi-Ethnic, Low-Income Areas |
0.00% |
2.10% |
0.00 |
|
| Unclassified |
0.01% |
0.06% |
10.32 |
|
|
 |
 |
 |
| £0-5K |
15.27% |
9.41% |
162.27 |
|
| £5-10K |
24.23% |
16.63% |
145.71 |
|
| £10-15K |
20.60% |
16.58% |
124.25 |
|
| £15-20K |
14.18% |
13.58% |
104.40 |
|
| £20-25K |
9.10% |
10.39% |
87.58 |
|
| £25-30K |
5.74% |
7.77% |
73.80 |
|
| £30-35K |
3.63% |
5.79% |
62.63 |
|
| £35-40K |
2.32% |
4.33% |
53.60 |
|
| £40-45K |
1.51% |
3.27% |
46.28 |
|
| £45-50K |
1.00% |
2.48% |
40.31 |
|
| £50-55K |
0.67% |
1.90% |
35.41 |
|
| £55-60K |
0.46% |
1.47% |
31.37 |
|
| £60-65K |
0.32% |
1.15% |
28.00 |
|
| £65-70K |
0.23% |
0.91% |
25.17 |
|
| £70-75K |
0.16% |
0.72% |
22.78 |
|
| £75-80K |
0.12% |
0.57% |
20.75 |
|
| £80-85K |
0.09% |
0.46% |
19.01 |
|
| £85-90K |
0.07% |
0.37% |
17.51 |
|
| £90-95K |
0.05% |
0.31% |
16.21 |
|
| £95-100K |
0.04% |
0.25% |
15.07 |
|
| £100K + |
0.14% |
1.34% |
10.78 |
|
|
|

|


|
1992-1997
|
1997-2001
|
|
|
|
| Con |
-4.00% |
| Lab |
-0.05% |
| LD |
0.35% |
| PC |
1.56% |
|
| Con |
0.85% |
| Lab |
-5.10% |
| LD |
-1.10% |
| PC |
8.09% |
|
|
 |
Chris Bryant
Labour hold
|
| Con |
 |
1,557 |
4.65% |
| Lab |
 |
23,230 |
69.35% |
| LD |
 |
1,525 |
4.55% |
| PC |
 |
7,183 |
21.44% |
| Oth |
|
0 |
0.00% |
| Maj |
 |
16,047 |
47.91% |
| Turn |
 |
33,495 |
59.75% |
|
|
 |
Chris Bryant
Labour hold
|
| L |
Chris Bryant |
23,230 |
69.35% |
| LD |
Gavin Cox |
1,525 |
4.55% |
| C |
Peter Hobbins |
1,557 |
4.65% |
| PC |
Leanne Wood |
7,183 |
21.44% |
|
Candidates representing 4 parties stood for election to this seat.
|
|
 |
Allan Rogers
Labour
|
| Con |
 |
1,551 |
3.80% |
| Lab |
 |
30,381 |
74.45% |
| LD |
 |
2,307 |
5.65% |
| PC |
 |
5,450 |
13.36% |
| Ref |
 |
658 |
1.61% |
| Oth |
 |
460 |
1.13% |
| Maj |
 |
24,931 |
61.09% |
| Turn |
 |
40,807 |
71.46% |
|
|
 |
|
Labour
|
| Con |
 |
3,588 |
7.80% |
| Lab |
 |
34,243 |
74.50% |
| LD |
 |
2,431 |
5.30% |
| PC |
 |
5,427 |
11.80% |
| Oth |
 |
245 |
0.50% |
| Maj |
 |
28,816 |
62.70% |
| Turn |
 |
45,934 |
75.97% |
|
|
 |
|

|

