|
Ribble South
Labour hold

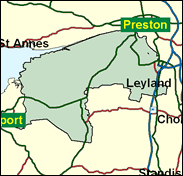
The south bank of the river Ribble in Lancashire should see one of the closest and most important constituency contests of the next General Election, bar almost none. All the ingredients are there. Last time David Borrow (who subsequently became the fifth current MP to declare his homosexuality) ousted the Conservative Robert Atkins by 9pc or 5,000 votes. If the Tories were to regain the seat on a nationally uniform swing they would win about sixty others from Labour, reducing Tony Blair's overall majority to 60, a third of its present level. The South Ribble area is very evenly divided, and tightly fought at local level. In the 1999 Borough elections Labour won 39pc of the vote here and returned 21 councillors, the Conservatives 37pc with 18, and there are a few very Tory wards from West Lancashire in the seat as well. In the Euro elections the next month, the Tories beat Labour within South Ribble's boundaries by 13pc, making it their 35th best showing in Labour-held seats. The figures point to a battle royal; so does the passion.

David Borrow is a Labour backbencher emblematic of the 1997 intake: a public sector employee (local government officer) and local (Preston) councillor, diligent over local concerns - in his case the aerospace industry, loyal to the Government and one of a small number of Labour MPs to declare his homosexuality. Born in 1952 and educated at Mirfield Grammar School and Lanchester Polytechnic, less typically he came with a history of factional in-fighting on Preston Council where he was temporarily ousted from the leadership by the hard left Valerie Wise. His right-wing Conservative challenger is Adrian Owens, born 1965 and educated at Marist (RC) College, Hull and Trinity College Cambridge. A manager previously with Rank Hovis McDougall and Robertson's Jams, he currently runs CREATE, training the long-term unemployed. A member of the Institute of Economic Affairs, his past involvement with SPUC will not go amiss in a still strongly Catholic area.
 |
| Wealthy Achievers, Suburban Areas |
20.13% |
14.99% |
134.24 |
|
| Affluent Greys, Rural Communities |
1.06% |
2.13% |
49.90 |
|
| Prosperous Pensioners, Retirement Areas |
0.59% |
2.49% |
23.63 |
|
| Affluent Executives, Family Areas |
6.27% |
4.43% |
141.76 |
|
| Well-Off Workers, Family Areas |
20.74% |
7.27% |
285.17 |
|
| Affluent Urbanites, Town & City Areas |
0.62% |
2.56% |
24.17 |
|
| Prosperous Professionals, Metropolitan Areas |
0.00% |
2.04% |
0.00 |
|
| Better-Off Executives, Inner City Areas |
0.00% |
3.94% |
0.00 |
|
| Comfortable Middle Agers, Mature Home Owning Areas |
22.59% |
13.04% |
173.21 |
|
| Skilled Workers, Home Owning Areas |
14.61% |
12.70% |
114.99 |
|
| New Home Owners, Mature Communities |
5.51% |
8.14% |
67.66 |
|
| White Collar Workers, Better-Off Multi Ethnic Areas |
0.26% |
4.02% |
6.52 |
|
| Older People, Less Prosperous Areas |
1.38% |
3.19% |
43.28 |
|
| Council Estate Residents, Better-Off Homes |
4.67% |
11.31% |
41.30 |
|
| Council Estate Residents, High Unemployment |
0.48% |
3.06% |
15.60 |
|
| Council Estate Residents, Greatest Hardship |
1.10% |
2.52% |
43.54 |
|
| People in Multi-Ethnic, Low-Income Areas |
0.00% |
2.10% |
0.00 |
|
| Unclassified |
0.00% |
0.06% |
0.00 |
|
|
 |
 |
 |
| £0-5K |
6.59% |
9.41% |
70.03 |
|
| £5-10K |
14.33% |
16.63% |
86.15 |
|
| £10-15K |
16.27% |
16.58% |
98.14 |
|
| £15-20K |
14.47% |
13.58% |
106.49 |
|
| £20-25K |
11.60% |
10.39% |
111.66 |
|
| £25-30K |
8.89% |
7.77% |
114.33 |
|
| £30-35K |
6.67% |
5.79% |
115.19 |
|
| £35-40K |
4.97% |
4.33% |
114.77 |
|
| £40-45K |
3.71% |
3.27% |
113.50 |
|
| £45-50K |
2.77% |
2.48% |
111.66 |
|
| £50-55K |
2.09% |
1.90% |
109.49 |
|
| £55-60K |
1.58% |
1.47% |
107.11 |
|
| £60-65K |
1.20% |
1.15% |
104.64 |
|
| £65-70K |
0.93% |
0.91% |
102.14 |
|
| £70-75K |
0.72% |
0.72% |
99.66 |
|
| £75-80K |
0.56% |
0.57% |
97.22 |
|
| £80-85K |
0.44% |
0.46% |
94.86 |
|
| £85-90K |
0.35% |
0.37% |
92.56 |
|
| £90-95K |
0.28% |
0.31% |
90.36 |
|
| £95-100K |
0.22% |
0.25% |
88.24 |
|
| £100K + |
1.03% |
1.34% |
76.42 |
|
|
|

|


|
1992-1997
|
1997-2001
|
|
|
|
| Con |
-12.19% |
| Lab |
12.01% |
| LD |
-4.16% |
|
| Con |
0.53% |
| Lab |
-0.45% |
| LD |
4.86% |
|
|
 |
David Borrow
Labour hold
|
| Con |
 |
17,594 |
38.14% |
| Lab |
 |
21,386 |
46.36% |
| LD |
 |
7,150 |
15.50% |
| Oth |
|
0 |
0.00% |
| Maj |
 |
3,792 |
8.22% |
| Turn |
 |
46,130 |
62.51% |
|
|
 |
David Borrow
Labour hold
|
| LD |
Mark Alcock |
7,150 |
15.50% |
| L |
David Borrow |
21,386 |
46.36% |
| C |
Adrian Owens |
17,594 |
38.14% |
|
Candidates representing 3 parties stood for election to this seat.
|
|
 |
Dennis Golden
Labour gain
|
| Con |
 |
20,772 |
37.61% |
| Lab |
 |
25,856 |
46.81% |
| LD |
 |
5,879 |
10.64% |
| Ref |
 |
1,475 |
2.67% |
| Oth |
 |
1,249 |
2.26% |
| Maj |
 |
5,084 |
9.20% |
| Turn |
 |
55,231 |
77.06% |
|
|
 |
|
Conservative
|
| Con |
 |
29,366 |
49.80% |
| Lab |
 |
20,526 |
34.80% |
| LD |
 |
8,695 |
14.80% |
| Oth |
 |
326 |
0.60% |
| Maj |
 |
8,840 |
15.00% |
| Turn |
 |
58,913 |
82.97% |
|
|
 |
|

|

