|
Ribble Valley
Conservative hold

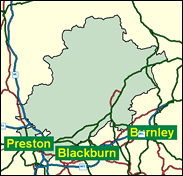
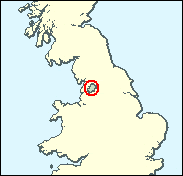
The Ribble Valley seems an identikit Tory division, although it is situated in the north of England, with its mixture of extremely attractive countryside and villages in the haunting Forest of Bowland, prosperous small towns like Clitheroe, Longridge and Whalley, expanded villages within the catchment areas of Burnley and Blackburn, and the most middle class suburb of Preston, Fulwood. It was won by the Liberal Democrat Mike Carr in a by-election in 1991, but the Conservatives could not have held on to any vacancy in the transitional Thatcher-Major era (or indeed the eras on either side of that, late- Thatcher and whole-of-Major). Nigel Evans reversed the result rather easily the next year and it has now reverted to its accustomed preferences.

Nigel Evans, an itinerant Welsh newsagent and tobacconist, won here in 1992, having lost the safe seat to the Liberal Democrats at the 1991 poll-tax dominated byelection. Born 1957 and educated at Dynevor School, Swansea and Swansea University, with a family newsagent's business, somewhat unavoidably - given his party's Welsh wipe-out - he sits on the frontbench as spokesman for Welsh affairs. A gimlet-eyed, partisan, professional politician, he signed up for all the passing orthodoxies, whether "Walkerite" (in Wales), Thatcherite or Majorite, and loyally backed the Maastricht legislation. In Opposition he dismissed Welsh devolution as "a turbo-charged county council", and has taken to voting for 16 as the homosexual age of consent.
 |
| Wealthy Achievers, Suburban Areas |
33.68% |
14.99% |
224.65 |
|
| Affluent Greys, Rural Communities |
3.10% |
2.13% |
145.83 |
|
| Prosperous Pensioners, Retirement Areas |
0.35% |
2.49% |
14.24 |
|
| Affluent Executives, Family Areas |
6.05% |
4.43% |
136.82 |
|
| Well-Off Workers, Family Areas |
11.68% |
7.27% |
160.65 |
|
| Affluent Urbanites, Town & City Areas |
0.17% |
2.56% |
6.51 |
|
| Prosperous Professionals, Metropolitan Areas |
0.15% |
2.04% |
7.26 |
|
| Better-Off Executives, Inner City Areas |
0.38% |
3.94% |
9.66 |
|
| Comfortable Middle Agers, Mature Home Owning Areas |
19.98% |
13.04% |
153.23 |
|
| Skilled Workers, Home Owning Areas |
13.02% |
12.70% |
102.52 |
|
| New Home Owners, Mature Communities |
2.73% |
8.14% |
33.51 |
|
| White Collar Workers, Better-Off Multi Ethnic Areas |
2.29% |
4.02% |
57.01 |
|
| Older People, Less Prosperous Areas |
2.43% |
3.19% |
76.14 |
|
| Council Estate Residents, Better-Off Homes |
2.38% |
11.31% |
21.05 |
|
| Council Estate Residents, High Unemployment |
0.32% |
3.06% |
10.50 |
|
| Council Estate Residents, Greatest Hardship |
0.12% |
2.52% |
4.73 |
|
| People in Multi-Ethnic, Low-Income Areas |
0.00% |
2.10% |
0.00 |
|
| Unclassified |
1.15% |
0.06% |
1,852.22 |
|
|
 |
|
|
| £0-5K |
4.97% |
9.41% |
52.84 |
|
| £5-10K |
11.79% |
16.63% |
70.86 |
|
| £10-15K |
14.37% |
16.58% |
86.67 |
|
| £15-20K |
13.57% |
13.58% |
99.90 |
|
| £20-25K |
11.49% |
10.39% |
110.59 |
|
| £25-30K |
9.26% |
7.77% |
119.09 |
|
| £30-35K |
7.29% |
5.79% |
125.78 |
|
| £35-40K |
5.68% |
4.33% |
131.02 |
|
| £40-45K |
4.41% |
3.27% |
135.09 |
|
| £45-50K |
3.43% |
2.48% |
138.23 |
|
| £50-55K |
2.68% |
1.90% |
140.62 |
|
| £55-60K |
2.10% |
1.47% |
142.40 |
|
| £60-65K |
1.65% |
1.15% |
143.71 |
|
| £65-70K |
1.31% |
0.91% |
144.63 |
|
| £70-75K |
1.04% |
0.72% |
145.24 |
|
| £75-80K |
0.84% |
0.57% |
145.59 |
|
| £80-85K |
0.67% |
0.46% |
145.73 |
|
| £85-90K |
0.55% |
0.37% |
145.71 |
|
| £90-95K |
0.44% |
0.31% |
145.56 |
|
| £95-100K |
0.36% |
0.25% |
145.30 |
|
| £100K + |
1.90% |
1.34% |
141.56 |
|
|
|
|


|
1992-1997
|
1997-2001
|
|
|
|
| Con |
-5.94% |
| Lab |
7.05% |
| LD |
-3.14% |
|
| Con |
4.80% |
| Lab |
4.17% |
| LD |
-6.45% |
|
|
|
Nigel Evans
Conservative hold
|
| Con |
 |
25,308 |
51.47% |
| Lab |
 |
9,793 |
19.92% |
| LD |
 |
14,070 |
28.61% |
| Oth |
|
0 |
0.00% |
| Maj |
 |
11,238 |
22.85% |
| Turn |
|
49,171 |
66.16% |
|
|
|
Nigel Evans
Conservative hold
|
| LD |
Mike Carr |
14,070 |
28.61% |
| C |
Nigel Evans |
25,308 |
51.47% |
| L |
Marcus Johnstone |
9,793 |
19.92% |
|
Candidates representing 3 parties stood for election to this seat.
|
|
|
Nigel Evans
Conservative
|
| Con |
|
26,702 |
46.66% |
| Lab |
|
9,013 |
15.75% |
| LD |
|
20,062 |
35.06% |
| Ref |
 |
1,297 |
2.27% |
| Oth |
 |
147 |
0.26% |
| Maj |
|
6,640 |
11.60% |
| Turn |
|
57,221 |
78.75% |
|
|
|
|
Conservative
|
| Con |
|
31,629 |
52.60% |
| Lab |
|
5,254 |
8.70% |
| LD |
|
23,000 |
38.20% |
| Oth |
|
282 |
0.50% |
| Maj |
|
8,629 |
14.30% |
| Turn |
|
60,165 |
84.43% |
|
|
|
|
|