|
Beverley & Holderness
Conservative hold

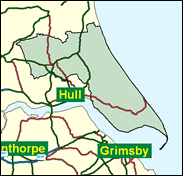
James Cran held this East Yorkshire seat by only 1,211 votes in the 1997 general election (some reference books wrongly give this figure as 811), but he should increase that substantially this time. All the evidence points that way: a 21pc lead in the June 1999 Euro-elections, following a poor Labour showing in the new unitary authority of the East Riding the previous month. Both the town of Beverley, the administrative headquarters of the East Riding and a prosperous commuting base for Hull, and the rural lands of the mysterious peninsula of Holderness, tapering down to the sea-threatened sand spit of Spurn Head, are basically Conservative.

James Cran, a flinty Aberdonian law and order traditionalist, Eurosceptic and Opposition Whip, has been MP here since 1987. Born 1944 and educated at Ruthrieston School Aberdeen, and Aberdeen University, he worked originally for the National Association of Pension Funds and then the CBI. He was ‘Chief Whip' of the Maastricht rebels, though denying he was a natural rebel, and hesitating to bring down Major if the alternative was Heseltine. In 1997 he voted for Howard, then Redwood, then Hague - rejecting Redwood's pact with Clarke, because of Clarke's Europhilia. In April 2001 he refused to sign the CRE's anti-racism pledge.
 |
| Wealthy Achievers, Suburban Areas |
22.50% |
14.99% |
150.06 |
|
| Affluent Greys, Rural Communities |
3.24% |
2.13% |
152.27 |
|
| Prosperous Pensioners, Retirement Areas |
1.40% |
2.49% |
56.14 |
|
| Affluent Executives, Family Areas |
7.51% |
4.43% |
169.77 |
|
| Well-Off Workers, Family Areas |
13.84% |
7.27% |
190.32 |
|
| Affluent Urbanites, Town & City Areas |
0.47% |
2.56% |
18.49 |
|
| Prosperous Professionals, Metropolitan Areas |
0.77% |
2.04% |
37.83 |
|
| Better-Off Executives, Inner City Areas |
0.27% |
3.94% |
6.90 |
|
| Comfortable Middle Agers, Mature Home Owning Areas |
23.03% |
13.04% |
176.61 |
|
| Skilled Workers, Home Owning Areas |
11.79% |
12.70% |
92.81 |
|
| New Home Owners, Mature Communities |
6.24% |
8.14% |
76.61 |
|
| White Collar Workers, Better-Off Multi Ethnic Areas |
1.94% |
4.02% |
48.29 |
|
| Older People, Less Prosperous Areas |
4.11% |
3.19% |
128.92 |
|
| Council Estate Residents, Better-Off Homes |
2.75% |
11.31% |
24.33 |
|
| Council Estate Residents, High Unemployment |
0.11% |
3.06% |
3.70 |
|
| Council Estate Residents, Greatest Hardship |
0.02% |
2.52% |
0.90 |
|
| People in Multi-Ethnic, Low-Income Areas |
0.00% |
2.10% |
0.00 |
|
| Unclassified |
0.00% |
0.06% |
0.00 |
|
|
 |
 |
 |
| £0-5K |
8.27% |
9.41% |
87.82 |
|
| £5-10K |
15.47% |
16.63% |
93.03 |
|
| £10-15K |
16.27% |
16.58% |
98.11 |
|
| £15-20K |
13.88% |
13.58% |
102.19 |
|
| £20-25K |
10.92% |
10.39% |
105.05 |
|
| £25-30K |
8.30% |
7.77% |
106.80 |
|
| £30-35K |
6.24% |
5.79% |
107.66 |
|
| £35-40K |
4.67% |
4.33% |
107.84 |
|
| £40-45K |
3.51% |
3.27% |
107.52 |
|
| £45-50K |
2.65% |
2.48% |
106.84 |
|
| £50-55K |
2.02% |
1.90% |
105.90 |
|
| £55-60K |
1.54% |
1.47% |
104.78 |
|
| £60-65K |
1.19% |
1.15% |
103.55 |
|
| £65-70K |
0.93% |
0.91% |
102.24 |
|
| £70-75K |
0.73% |
0.72% |
100.88 |
|
| £75-80K |
0.57% |
0.57% |
99.51 |
|
| £80-85K |
0.45% |
0.46% |
98.12 |
|
| £85-90K |
0.36% |
0.37% |
96.74 |
|
| £90-95K |
0.29% |
0.31% |
95.38 |
|
| £95-100K |
0.24% |
0.25% |
94.04 |
|
| £100K + |
1.15% |
1.34% |
85.65 |
|
|
|

|


|
1992-1997
|
1997-2001
|
|
|
|
| Con |
-13.65% |
| Lab |
19.22% |
| LD |
-7.00% |
|
| Con |
0.48% |
| Lab |
0.33% |
| LD |
-2.44% |
|
|
 |
James Cran
Conservative hold
|
| Con |
 |
19,168 |
41.33% |
| Lab |
 |
18,387 |
39.65% |
| LD |
 |
7,356 |
15.86% |
| Oth |
 |
1,464 |
3.16% |
| Maj |
 |
781 |
1.68% |
| Turn |
 |
46,375 |
61.71% |
|
|
 |
James Cran
Conservative hold
|
| C |
James Cran |
19,168 |
41.33% |
| L |
Pippa Langford |
18,387 |
39.65% |
| UK |
Stephen Wallis |
1,464 |
3.16% |
| LD |
Stewart Willie |
7,356 |
15.86% |
|
Candidates representing 4 parties stood for election to this seat.
|
|
 |
James Cran
Conservative
|
| Con |
 |
21,629 |
40.85% |
| Lab |
 |
20,818 |
39.32% |
| LD |
 |
9,689 |
18.30% |
| Ref |
|
0 |
0.00% |
| Oth |
 |
806 |
1.52% |
| Maj |
 |
811 |
1.53% |
| Turn |
 |
52,942 |
73.62% |
|
|
 |
|
Conservative
|
| Con |
 |
29,800 |
54.50% |
| Lab |
 |
10,981 |
20.10% |
| LD |
 |
13,843 |
25.30% |
| Oth |
 |
62 |
0.10% |
| Maj |
 |
15,957 |
29.20% |
| Turn |
 |
54,686 |
79.07% |
|
|
 |
|

|

