|
Richmond (Yorks)
Conservative hold

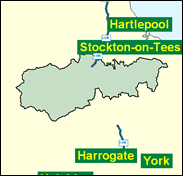
William Hague's seat was the 25th safest of his party's total of 165 in 1997, and that was before he was chosen for the testing task of Leader of the Opposition. He can at least rely on his constituency's support at the next general election, if not of his party's for much afterwards. It consists of vast swathes of the attractive Yorkshire northern dales, including Swaledale and Wensleydale, and if there is a blot on the Herriot landscape it comes in the form of Catterick army camp, one of the largest centres of population along with Northallerton and Richmond, but the armed service vote, when exercised, scarcely hold any terrors for Conservatives.

William Hague, MP here since 1989, was elected leader of the Conservative Party in 1997, too soon at the age of 36, and with his deft dispatch box performance watched by all too few. A flexible politician who has opted for a populist Euroscepticism of limited appeal to many middle-class Tory voters, he was born 1961, son of a soft drinks manufacturer, and educated at Wath-on-Dearne Comprehensive School and at Magdalen College Oxford. The last bald prime minister was his impersonated hero, Sir Winston Churchill, 46 years ago; the last bald opposition leader was Neil Kinnock.
 |
| Wealthy Achievers, Suburban Areas |
27.90% |
14.99% |
186.09 |
|
| Affluent Greys, Rural Communities |
13.95% |
2.13% |
655.89 |
|
| Prosperous Pensioners, Retirement Areas |
3.09% |
2.49% |
124.37 |
|
| Affluent Executives, Family Areas |
6.48% |
4.43% |
146.55 |
|
| Well-Off Workers, Family Areas |
3.91% |
7.27% |
53.71 |
|
| Affluent Urbanites, Town & City Areas |
0.11% |
2.56% |
4.46 |
|
| Prosperous Professionals, Metropolitan Areas |
0.00% |
2.04% |
0.00 |
|
| Better-Off Executives, Inner City Areas |
0.49% |
3.94% |
12.41 |
|
| Comfortable Middle Agers, Mature Home Owning Areas |
22.21% |
13.04% |
170.35 |
|
| Skilled Workers, Home Owning Areas |
5.03% |
12.70% |
39.56 |
|
| New Home Owners, Mature Communities |
4.35% |
8.14% |
53.37 |
|
| White Collar Workers, Better-Off Multi Ethnic Areas |
2.67% |
4.02% |
66.33 |
|
| Older People, Less Prosperous Areas |
2.00% |
3.19% |
62.83 |
|
| Council Estate Residents, Better-Off Homes |
6.23% |
11.31% |
55.12 |
|
| Council Estate Residents, High Unemployment |
0.04% |
3.06% |
1.21 |
|
| Council Estate Residents, Greatest Hardship |
0.54% |
2.52% |
21.44 |
|
| People in Multi-Ethnic, Low-Income Areas |
0.00% |
2.10% |
0.00 |
|
| Unclassified |
1.00% |
0.06% |
1,605.18 |
|
|
 |
 |
 |
| £0-5K |
6.69% |
9.41% |
71.10 |
|
| £5-10K |
14.73% |
16.63% |
88.53 |
|
| £10-15K |
16.75% |
16.58% |
101.05 |
|
| £15-20K |
14.68% |
13.58% |
108.06 |
|
| £20-25K |
11.53% |
10.39% |
110.94 |
|
| £25-30K |
8.66% |
7.77% |
111.37 |
|
| £30-35K |
6.40% |
5.79% |
110.55 |
|
| £35-40K |
4.73% |
4.33% |
109.17 |
|
| £40-45K |
3.51% |
3.27% |
107.60 |
|
| £45-50K |
2.63% |
2.48% |
106.02 |
|
| £50-55K |
1.99% |
1.90% |
104.52 |
|
| £55-60K |
1.52% |
1.47% |
103.12 |
|
| £60-65K |
1.17% |
1.15% |
101.84 |
|
| £65-70K |
0.91% |
0.91% |
100.66 |
|
| £70-75K |
0.72% |
0.72% |
99.58 |
|
| £75-80K |
0.57% |
0.57% |
98.59 |
|
| £80-85K |
0.45% |
0.46% |
97.69 |
|
| £85-90K |
0.36% |
0.37% |
96.86 |
|
| £90-95K |
0.29% |
0.31% |
96.10 |
|
| £95-100K |
0.24% |
0.25% |
95.40 |
|
| £100K + |
1.24% |
1.34% |
92.10 |
|
|
|

|


|
1992-1997
|
1997-2001
|
|
|
|
| Con |
-11.54% |
| Lab |
16.31% |
| LD |
-8.72% |
|
| Con |
10.07% |
| Lab |
-5.93% |
| LD |
-0.46% |
|
|
 |
William Hague
Conservative hold
|
| Con |
 |
25,951 |
58.93% |
| Lab |
 |
9,632 |
21.87% |
| LD |
 |
7,890 |
17.92% |
| Oth |
 |
561 |
1.27% |
| Maj |
 |
16,319 |
37.06% |
| Turn |
 |
44,034 |
67.37% |
|
|
 |
William Hague
Conservative hold
|
| LD |
Edward Forth |
7,890 |
17.92% |
| C |
William Hague |
25,951 |
58.93% |
| ML |
Melodie Staniforth |
561 |
1.27% |
| L |
Fay Tinnion |
9,632 |
21.87% |
|
Candidates representing 4 parties stood for election to this seat.
|
|
 |
William Hague
Conservative
|
| Con |
 |
23,326 |
48.86% |
| Lab |
 |
13,275 |
27.81% |
| LD |
 |
8,773 |
18.38% |
| Ref |
 |
2,367 |
4.96% |
| Oth |
|
0 |
0.00% |
| Maj |
 |
10,051 |
21.05% |
| Turn |
 |
47,741 |
73.38% |
|
|
 |
|
Conservative
|
| Con |
 |
30,333 |
60.40% |
| Lab |
 |
5,797 |
11.50% |
| LD |
 |
13,626 |
27.10% |
| Oth |
 |
445 |
0.90% |
| Maj |
 |
16,707 |
33.30% |
| Turn |
 |
50,201 |
78.09% |
|
|
 |
|

|

