|
Richmond Park
Liberal Democrat hold

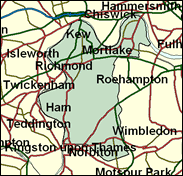
Boundary changes made this long term Liberal target in affluent and intellectual south west London a surprise gain for Jenny Tonge in 1997. Despite her party's long-term local government strength in Richmond Borough, the addition of five Kingston wards with little such tradition made jovial Jeremy Hanley the favourite. In the 1998 London Borough elections the Lib Dems were only three pc ahead of the Tories here, but Jenny Tonge has been active and in the main popular and has probably built up sufficient of a positive profile to make an increase in her 2,951 majority the most likely outcome.

Dr Jenny Tonge, a former GP and local councillor, won the seat at her second attempt in 1997. A pleasant-looking woman with a sultry voice - if seen by her defeated Conservative opponent Sir Jeremy Hanley as an old bruiser, she endeavours to square-up to the brusque and bullying Clare Short as International Development spokesman, and takes a practical GP's liberal line on matters relating to teenage contraception and drugs. Born 1941 and educated at Dudley Girls High School and University College Hospital Medical School, she sits on her Party's social democratic wing as an advocate of more taxation and assiduously pursues constituency interests such as incessant aircraft noise, notwithstanding her own advantageous deafness in one ear. Her Conservative challenger is Tom Harris, born 1967, educated at Marlborough and Nottingham University and a stockbroker with Cazenoves. A former Guildford Cathedral chorister, Old Marlburian cricketer and a Skinner's Company liveryman, like many aspiring Tory candidates he comes from Wandsworth Council, where he represents the adjacent-to-Richmond Roehampton ward.
 |
| Wealthy Achievers, Suburban Areas |
17.49% |
14.99% |
116.62 |
|
| Affluent Greys, Rural Communities |
0.00% |
2.13% |
0.00 |
|
| Prosperous Pensioners, Retirement Areas |
1.73% |
2.49% |
69.68 |
|
| Affluent Executives, Family Areas |
1.14% |
4.43% |
25.69 |
|
| Well-Off Workers, Family Areas |
0.10% |
7.27% |
1.33 |
|
| Affluent Urbanites, Town & City Areas |
24.10% |
2.56% |
939.53 |
|
| Prosperous Professionals, Metropolitan Areas |
32.60% |
2.04% |
1,597.21 |
|
| Better-Off Executives, Inner City Areas |
7.84% |
3.94% |
198.82 |
|
| Comfortable Middle Agers, Mature Home Owning Areas |
4.78% |
13.04% |
36.66 |
|
| Skilled Workers, Home Owning Areas |
1.54% |
12.70% |
12.13 |
|
| New Home Owners, Mature Communities |
3.00% |
8.14% |
36.87 |
|
| White Collar Workers, Better-Off Multi Ethnic Areas |
2.83% |
4.02% |
70.48 |
|
| Older People, Less Prosperous Areas |
0.51% |
3.19% |
16.07 |
|
| Council Estate Residents, Better-Off Homes |
1.12% |
11.31% |
9.87 |
|
| Council Estate Residents, High Unemployment |
1.12% |
3.06% |
36.43 |
|
| Council Estate Residents, Greatest Hardship |
0.03% |
2.52% |
1.19 |
|
| People in Multi-Ethnic, Low-Income Areas |
0.02% |
2.10% |
0.85 |
|
| Unclassified |
0.06% |
0.06% |
102.61 |
|
|
 |
 |
 |
| £0-5K |
3.40% |
9.41% |
36.12 |
|
| £5-10K |
7.54% |
16.63% |
45.30 |
|
| £10-15K |
9.84% |
16.58% |
59.38 |
|
| £15-20K |
10.32% |
13.58% |
75.96 |
|
| £20-25K |
9.76% |
10.39% |
93.91 |
|
| £25-30K |
8.75% |
7.77% |
112.55 |
|
| £30-35K |
7.61% |
5.79% |
131.44 |
|
| £35-40K |
6.51% |
4.33% |
150.28 |
|
| £40-45K |
5.51% |
3.27% |
168.87 |
|
| £45-50K |
4.64% |
2.48% |
187.09 |
|
| £50-55K |
3.90% |
1.90% |
204.86 |
|
| £55-60K |
3.28% |
1.47% |
222.13 |
|
| £60-65K |
2.75% |
1.15% |
238.90 |
|
| £65-70K |
2.31% |
0.91% |
255.15 |
|
| £70-75K |
1.95% |
0.72% |
270.88 |
|
| £75-80K |
1.64% |
0.57% |
286.11 |
|
| £80-85K |
1.39% |
0.46% |
300.85 |
|
| £85-90K |
1.18% |
0.37% |
315.12 |
|
| £90-95K |
1.00% |
0.31% |
328.94 |
|
| £95-100K |
0.86% |
0.25% |
342.33 |
|
| £100K + |
5.68% |
1.34% |
422.43 |
|
|
|

|


|
1992-1997
|
1997-2001
|
|
|
|
| Con |
-12.33% |
| Lab |
3.81% |
| LD |
7.06% |
|
| Con |
-1.88% |
| Lab |
-1.34% |
| LD |
3.03% |
|
|
 |
Jenny Tonge
Liberal Democrat hold
|
| Con |
 |
18,480 |
37.60% |
| Lab |
 |
5,541 |
11.27% |
| LD |
 |
23,444 |
47.70% |
| Oth |
 |
1,686 |
3.43% |
| Maj |
 |
4,964 |
10.10% |
| Turn |
 |
49,151 |
67.64% |
|
|
 |
Jenny Tonge
Liberal Democrat hold
|
| C |
Tom Harris |
18,480 |
37.60% |
| L |
Barry Langford |
5,541 |
11.27% |
| G |
James Page |
1,223 |
2.49% |
| I |
Raymong Perrin |
115 |
0.23% |
| UK |
Peter St John Howe |
348 |
0.71% |
| LD |
Jenny Tonge |
23,444 |
47.70% |
|
Candidates representing 6 parties stood for election to this seat.
|
|
 |
Jenny Tonge
Liberal Democrat gain
|
| Con |
 |
22,442 |
39.47% |
| Lab |
 |
7,172 |
12.61% |
| LD |
 |
25,393 |
44.66% |
| Ref |
 |
1,467 |
2.58% |
| Oth |
 |
379 |
0.67% |
| Maj |
 |
2,951 |
5.19% |
| Turn |
 |
56,853 |
79.43% |
|
|
 |
|
Conservative
|
| Con |
 |
30,609 |
51.80% |
| Lab |
 |
5,211 |
8.80% |
| LD |
 |
22,225 |
37.60% |
| Oth |
 |
1,008 |
1.70% |
| Maj |
 |
8,384 |
14.20% |
| Turn |
 |
59,053 |
85.47% |
|
|
 |
|

|

