|
Rochford & Southend East
Conservative hold

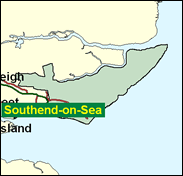
The east end of Southend on Sea is the lass fashionable, and the less affluent, with the exception of Thorpe, which some think is the place to live in the town; yet it has usually been the more Conservative. This is largely because Southend West has been the site for a sustained if ultimately unsuccessful Liberal assault, while the party of local activism has concentrated less firepower here (and obtained fewer than one tenth of the votes in this constituency in 1997). East, though socially and economically in average sectors by national standards, has seen the Conservatives see off Labour, though narrowly in landslide years like 1966 and in the 1980 by-election when Teddy Taylor returned to Parliament after finally being ousted in Glasgow. It might have been close in 1997 too, had it not been for two factors. Boundary changes brought in the land east and north east of Southend, the towns of Rochford and Great Wakering, and the sparsely populated flatlands between the river Roach and the mouth of the Thames, which include Foulness, the site of the once-proposed Maplin Sands London airport. Also Teddy Taylor's long and consistent opposition to further encroachments on UK liberties by the European Union meant that he was not opposed by a Referendum or UK Independence candidate, who might have tapped a strong vein of feeling here. He should survive to continue his defence of these islands after the next general election.

Following the election Sir Teddy Taylor will have served as a Conservative MP for 37 years, with a short break of ten months in 1979/80. An energetic, populist Glaswegian who lost his Glasgow seat after 15 years in 1979, he switched , as all Scots Tories must, to England in order to resume his career at Southend in 1980. Stocky and bald and from a lower middle class background, born in 1937 and educated at Glasgow High School and Glasgow University, his one-club political career was determined in 1971 when he quit his junior ministerial job over Heath's decision to apply for EEC membership, since when he has been in the van of every Europhobic revolt, losing the Whip in 1994. Like many of his anti-EU ilk an unclubbable loner, he is however seen as "nutty but nice" in his old fashioned suit, redolent of a character from an Ealing comedy. He accompanies his Europhobia with across-the-board rightwing sentiments on hanging, homosexuality, abortion and immigration, but is in the small Conservative minority opposing fox hunting. Needless to say, unlike the hapless Tories left behind in Scotland, he opposes devolution as a root-and-branch Unionist.
 |
| Wealthy Achievers, Suburban Areas |
13.70% |
14.99% |
91.35 |
|
| Affluent Greys, Rural Communities |
0.00% |
2.13% |
0.00 |
|
| Prosperous Pensioners, Retirement Areas |
4.43% |
2.49% |
178.15 |
|
| Affluent Executives, Family Areas |
1.65% |
4.43% |
37.20 |
|
| Well-Off Workers, Family Areas |
2.49% |
7.27% |
34.21 |
|
| Affluent Urbanites, Town & City Areas |
1.86% |
2.56% |
72.67 |
|
| Prosperous Professionals, Metropolitan Areas |
1.22% |
2.04% |
59.74 |
|
| Better-Off Executives, Inner City Areas |
10.03% |
3.94% |
254.36 |
|
| Comfortable Middle Agers, Mature Home Owning Areas |
17.90% |
13.04% |
137.31 |
|
| Skilled Workers, Home Owning Areas |
12.06% |
12.70% |
94.93 |
|
| New Home Owners, Mature Communities |
8.87% |
8.14% |
108.88 |
|
| White Collar Workers, Better-Off Multi Ethnic Areas |
9.22% |
4.02% |
229.35 |
|
| Older People, Less Prosperous Areas |
4.06% |
3.19% |
127.44 |
|
| Council Estate Residents, Better-Off Homes |
7.73% |
11.31% |
68.38 |
|
| Council Estate Residents, High Unemployment |
2.79% |
3.06% |
91.04 |
|
| Council Estate Residents, Greatest Hardship |
1.99% |
2.52% |
79.06 |
|
| People in Multi-Ethnic, Low-Income Areas |
0.00% |
2.10% |
0.00 |
|
| Unclassified |
0.00% |
0.06% |
0.00 |
|
|
 |
 |
 |
| £0-5K |
9.90% |
9.41% |
105.16 |
|
| £5-10K |
16.47% |
16.63% |
99.04 |
|
| £10-15K |
16.35% |
16.58% |
98.60 |
|
| £15-20K |
13.48% |
13.58% |
99.28 |
|
| £20-25K |
10.40% |
10.39% |
100.04 |
|
| £25-30K |
7.82% |
7.77% |
100.64 |
|
| £30-35K |
5.85% |
5.79% |
101.04 |
|
| £35-40K |
4.39% |
4.33% |
101.25 |
|
| £40-45K |
3.31% |
3.27% |
101.32 |
|
| £45-50K |
2.51% |
2.48% |
101.28 |
|
| £50-55K |
1.93% |
1.90% |
101.16 |
|
| £55-60K |
1.49% |
1.47% |
100.98 |
|
| £60-65K |
1.16% |
1.15% |
100.77 |
|
| £65-70K |
0.91% |
0.91% |
100.52 |
|
| £70-75K |
0.72% |
0.72% |
100.27 |
|
| £75-80K |
0.57% |
0.57% |
100.00 |
|
| £80-85K |
0.46% |
0.46% |
99.72 |
|
| £85-90K |
0.37% |
0.37% |
99.45 |
|
| £90-95K |
0.30% |
0.31% |
99.17 |
|
| £95-100K |
0.25% |
0.25% |
98.90 |
|
| £100K + |
1.30% |
1.34% |
97.01 |
|
|
|

|


|
1992-1997
|
1997-2001
|
|
|
|
| Con |
-10.32% |
| Lab |
12.11% |
| LD |
-2.39% |
|
| Con |
4.88% |
| Lab |
-4.84% |
| LD |
-1.99% |
|
|
 |
Teddy Taylor
Conservative hold
|
| Con |
 |
20,058 |
53.56% |
| Lab |
 |
13,024 |
34.78% |
| LD |
 |
2,780 |
7.42% |
| Oth |
 |
1,590 |
4.25% |
| Maj |
 |
7,034 |
18.78% |
| Turn |
 |
37,452 |
53.51% |
|
|
 |
Teddy Taylor
Conservative hold
|
| L |
Chris Dandridge |
13,024 |
34.78% |
| G |
Adrian Hedges |
990 |
2.64% |
| LB |
Brian Lynch |
600 |
1.60% |
| LD |
Stephen Newton |
2,780 |
7.42% |
| C |
Teddy Taylor |
20,058 |
53.56% |
|
Candidates representing 5 parties stood for election to this seat.
|
|
 |
Teddy Taylor
Conservative
|
| Con |
 |
22,683 |
48.68% |
| Lab |
 |
18,458 |
39.61% |
| LD |
 |
4,387 |
9.41% |
| Ref |
|
0 |
0.00% |
| Oth |
 |
1,070 |
2.30% |
| Maj |
 |
4,225 |
9.07% |
| Turn |
 |
46,598 |
63.97% |
|
|
 |
|
Conservative
|
| Con |
 |
30,096 |
59.00% |
| Lab |
 |
14,019 |
27.50% |
| LD |
 |
6,011 |
11.80% |
| Oth |
 |
861 |
1.70% |
| Maj |
 |
24,085 |
31.50% |
| Turn |
 |
50,987 |
75.91% |
|
|
 |
|

|

