|
Romford
Conservative gain

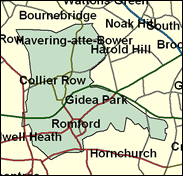
Of the three vulnerable seats in the London Borough of Havering, the Tories' best chance of all - and probably of any seat in London - comes in Romford. One of the reasons for this is that Labour's long-term strong performance in London may apply less in the Borough which is probably the most detached from the capital, and really feels - and feels itself - far more part of Essex county. A minuscule swing of less than one per cent will remove Eileen Gordon, and she correctly will consider herself extremely lucky if she survives the dynamic challenge of local councillor Andrew Rosindell.

Eileen Gordon, as Labour's fifth least expected new MP in 1997, ought to be one of the Party's most expected casualties in 2001. A former worker for Tony Banks MP, she was born in 1946 and educated at Harold Hill Grammar School and trained as a teacher. A working class feminist who was erroneously listed in 1997 as a Campaign Grouper, she has voted against the government only on air traffic control privatisation. She should face defeat at the hands of hard rightwinger Andrew Rosindell, archetypal Essex Man, Romford-born (1966)-and-bred, and active in opposing a single currency and a federal Europe as Director since 1997 of Bill Cash's European Foundation. He believes "we have reached as far as we want to go with the EU." An experienced political apparatchik with two parliamentary contests behind him and eleven years as PA to rightwing MP Vivian Bendall, he has a Staffordshire bull-terrier, Spike, who wears a Union Jack coat and has featured on News at Ten and in various election campaigns.
 |
| Wealthy Achievers, Suburban Areas |
11.36% |
14.99% |
75.74 |
|
| Affluent Greys, Rural Communities |
0.00% |
2.13% |
0.00 |
|
| Prosperous Pensioners, Retirement Areas |
0.59% |
2.49% |
23.60 |
|
| Affluent Executives, Family Areas |
0.02% |
4.43% |
0.35 |
|
| Well-Off Workers, Family Areas |
4.50% |
7.27% |
61.87 |
|
| Affluent Urbanites, Town & City Areas |
1.66% |
2.56% |
64.73 |
|
| Prosperous Professionals, Metropolitan Areas |
0.17% |
2.04% |
8.31 |
|
| Better-Off Executives, Inner City Areas |
1.09% |
3.94% |
27.58 |
|
| Comfortable Middle Agers, Mature Home Owning Areas |
37.78% |
13.04% |
289.72 |
|
| Skilled Workers, Home Owning Areas |
23.80% |
12.70% |
187.34 |
|
| New Home Owners, Mature Communities |
4.81% |
8.14% |
59.10 |
|
| White Collar Workers, Better-Off Multi Ethnic Areas |
1.91% |
4.02% |
47.53 |
|
| Older People, Less Prosperous Areas |
3.62% |
3.19% |
113.79 |
|
| Council Estate Residents, Better-Off Homes |
6.76% |
11.31% |
59.78 |
|
| Council Estate Residents, High Unemployment |
1.30% |
3.06% |
42.33 |
|
| Council Estate Residents, Greatest Hardship |
0.64% |
2.52% |
25.61 |
|
| People in Multi-Ethnic, Low-Income Areas |
0.00% |
2.10% |
0.00 |
|
| Unclassified |
0.00% |
0.06% |
0.00 |
|
|
 |
 |
 |
| £0-5K |
5.66% |
9.41% |
60.08 |
|
| £5-10K |
11.52% |
16.63% |
69.25 |
|
| £10-15K |
13.71% |
16.58% |
82.72 |
|
| £15-20K |
13.05% |
13.58% |
96.05 |
|
| £20-25K |
11.22% |
10.39% |
107.98 |
|
| £25-30K |
9.19% |
7.77% |
118.20 |
|
| £30-35K |
7.34% |
5.79% |
126.71 |
|
| £35-40K |
5.79% |
4.33% |
133.68 |
|
| £40-45K |
4.55% |
3.27% |
139.30 |
|
| £45-50K |
3.57% |
2.48% |
143.77 |
|
| £50-55K |
2.80% |
1.90% |
147.28 |
|
| £55-60K |
2.21% |
1.47% |
149.99 |
|
| £60-65K |
1.75% |
1.15% |
152.03 |
|
| £65-70K |
1.39% |
0.91% |
153.51 |
|
| £70-75K |
1.11% |
0.72% |
154.53 |
|
| £75-80K |
0.89% |
0.57% |
155.18 |
|
| £80-85K |
0.72% |
0.46% |
155.51 |
|
| £85-90K |
0.58% |
0.37% |
155.58 |
|
| £90-95K |
0.47% |
0.31% |
155.43 |
|
| £95-100K |
0.39% |
0.25% |
155.10 |
|
| £100K + |
2.00% |
1.34% |
148.93 |
|
|
|

|


|
1992-1997
|
1997-2001
|
|
|
|
| Con |
-16.46% |
| Lab |
14.88% |
| LD |
-4.47% |
|
| Con |
11.39% |
| Lab |
-6.90% |
| LD |
0.10% |
|
|
 |
Andrew Rosindell
Conservative gain
|
| Con |
 |
18,931 |
53.03% |
| Lab |
 |
12,954 |
36.28% |
| LD |
 |
2,869 |
8.04% |
| Oth |
 |
947 |
2.65% |
| Maj |
 |
5,977 |
16.74% |
| Turn |
 |
35,701 |
59.61% |
|
|
 |
Andrew Rosindell
Conservative gain
|
| L |
Eileen Gordon |
12,954 |
36.28% |
| BNP |
Frank McAllister |
414 |
1.16% |
| LD |
Nigel Meyer |
2,869 |
8.04% |
| C |
Andrew Rosindell |
18,931 |
53.03% |
| UK |
Stephen Ward |
533 |
1.49% |
|
Candidates representing 5 parties stood for election to this seat.
|
|
 |
Eileen Gordon
Labour gain
|
| Con |
 |
17,538 |
41.64% |
| Lab |
 |
18,187 |
43.18% |
| LD |
 |
3,341 |
7.93% |
| Ref |
 |
1,431 |
3.40% |
| Oth |
 |
1,622 |
3.85% |
| Maj |
 |
649 |
1.54% |
| Turn |
 |
42,119 |
70.66% |
|
|
 |
|
Conservative
|
| Con |
 |
27,462 |
58.10% |
| Lab |
 |
13,398 |
28.30% |
| LD |
 |
5,865 |
12.40% |
| Oth |
 |
546 |
1.20% |
| Maj |
 |
14,064 |
29.80% |
| Turn |
 |
47,271 |
77.62% |
|
|
 |
|

|

