|
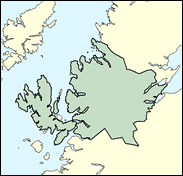
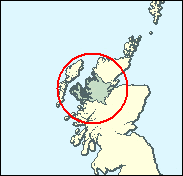
Ross, Skye & Inverness West
Liberal Democrat hold

Charles Kennedy is now leader of the Liberal Democrats, and this should make his grip on his vast Highlands home seat even more comfortable after 18 years as an MP (and he is still only 41). However, he scarcely needs the added personal kudos. In the 1999 Scottish Parliament elections the much less well known John Farquhar-Munro held the constituency for the party even against the formidable Donnie Munro, a broadcaster and former Rector of Edinburgh University (a post elected by the students, and thus conferring a specific type of legitimacy; often such posts in Scottish institutions of higher learning are occupied by comedians). Donnie Munro has given way to a new Labour candidate, Donald Crichton, and there is no reason to believe he will do any better among the canny and mature electorate of Ross, Skye and Inverness West.

Charles Kennedy, an MP at 23 and his Party's leader at 39 (in 1999), will, at the age of 78 in 2031 have overtaken Lloyd George's record of 55 years as an MP. Suffering, as all leaders of his party tend to, from not being taken seriously, he comes anyway with a reputation for not taking himself seriously. Victor in the leadership race over fellow bachelor (but more tortured) Simon Hughes, he is seen as less pro-Labour than Paddy Ashdown, but as with all Liberal Democrats, he has to weave between left and right, and to be nominally 'anti-Labour' is no bad thing with Europhile, but anti-Labour, disillusioned Conservative votes to secure. Born in 1959, a crofter's son of Catholic origins, he attended Lochaber High School, Fort William and Glasgow and Indiana Universities. Unlike most of his rural seat colleagues he votes the full abolition line on hunting.
 |
| Wealthy Achievers, Suburban Areas |
12.68% |
14.99% |
84.59 |
|
| Affluent Greys, Rural Communities |
21.59% |
2.13% |
1,015.26 |
|
| Prosperous Pensioners, Retirement Areas |
0.39% |
2.49% |
15.52 |
|
| Affluent Executives, Family Areas |
3.26% |
4.43% |
73.73 |
|
| Well-Off Workers, Family Areas |
4.83% |
7.27% |
66.34 |
|
| Affluent Urbanites, Town & City Areas |
1.41% |
2.56% |
54.92 |
|
| Prosperous Professionals, Metropolitan Areas |
0.01% |
2.04% |
0.68 |
|
| Better-Off Executives, Inner City Areas |
1.02% |
3.94% |
25.83 |
|
| Comfortable Middle Agers, Mature Home Owning Areas |
10.90% |
13.04% |
83.57 |
|
| Skilled Workers, Home Owning Areas |
2.57% |
12.70% |
20.21 |
|
| New Home Owners, Mature Communities |
8.59% |
8.14% |
105.49 |
|
| White Collar Workers, Better-Off Multi Ethnic Areas |
0.97% |
4.02% |
24.15 |
|
| Older People, Less Prosperous Areas |
3.34% |
3.19% |
104.90 |
|
| Council Estate Residents, Better-Off Homes |
14.11% |
11.31% |
124.77 |
|
| Council Estate Residents, High Unemployment |
2.66% |
3.06% |
87.01 |
|
| Council Estate Residents, Greatest Hardship |
11.67% |
2.52% |
463.45 |
|
| People in Multi-Ethnic, Low-Income Areas |
0.00% |
2.10% |
0.00 |
|
| Unclassified |
0.00% |
0.06% |
0.00 |
|
|
 |
 |
 |
| £0-5K |
10.66% |
9.41% |
113.22 |
|
| £5-10K |
19.32% |
16.63% |
116.15 |
|
| £10-15K |
18.60% |
16.58% |
112.21 |
|
| £15-20K |
14.46% |
13.58% |
106.47 |
|
| £20-25K |
10.43% |
10.39% |
100.39 |
|
| £25-30K |
7.35% |
7.77% |
94.53 |
|
| £30-35K |
5.16% |
5.79% |
89.06 |
|
| £35-40K |
3.64% |
4.33% |
84.05 |
|
| £40-45K |
2.60% |
3.27% |
79.48 |
|
| £45-50K |
1.87% |
2.48% |
75.32 |
|
| £50-55K |
1.36% |
1.90% |
71.53 |
|
| £55-60K |
1.00% |
1.47% |
68.07 |
|
| £60-65K |
0.75% |
1.15% |
64.91 |
|
| £65-70K |
0.56% |
0.91% |
62.01 |
|
| £70-75K |
0.43% |
0.72% |
59.35 |
|
| £75-80K |
0.33% |
0.57% |
56.89 |
|
| £80-85K |
0.25% |
0.46% |
54.62 |
|
| £85-90K |
0.20% |
0.37% |
52.51 |
|
| £90-95K |
0.15% |
0.31% |
50.56 |
|
| £95-100K |
0.12% |
0.25% |
48.74 |
|
| £100K + |
0.54% |
1.34% |
39.81 |
|
|
|

|


|
1992-1997
|
1997-2001
|
|
|
|
| Con |
-10.97% |
| Lab |
9.76% |
| LD |
0.02% |
| SNP |
0.77% |
|
| Con |
-1.74% |
| Lab |
-11.20% |
| LD |
17.20% |
| SNP |
-5.02% |
|
|
 |
Charles Kennedy
Liberal Democrat hold
|
| Con |
 |
3,096 |
9.19% |
| Lab |
 |
5,880 |
17.46% |
| LD |
 |
18,832 |
55.93% |
| SNP |
 |
4,901 |
14.55% |
| Oth |
 |
964 |
2.86% |
| Maj |
 |
12,952 |
38.46% |
| Turn |
 |
33,673 |
59.58% |
|
|
 |
Charles Kennedy
Liberal Democrat hold
|
| CN |
James Crawford |
265 |
0.79% |
| L |
Donald Crichton |
5,880 |
17.46% |
| LD |
Charles Kennedy |
18,832 |
55.93% |
| C |
Angus Laing |
3,096 |
9.19% |
| G |
Eleanor Scott |
699 |
2.08% |
| SNP |
Jean Urquhart |
4,901 |
14.55% |
|
Candidates representing 6 parties stood for election to this seat.
|
|
 |
Charles Kennedy
Liberal Democrat
|
| Con |
 |
4,368 |
10.93% |
| Lab |
 |
11,453 |
28.66% |
| LD |
 |
15,472 |
38.72% |
| SNP |
 |
7,821 |
19.57% |
| Ref |
 |
535 |
1.34% |
| Oth |
 |
306 |
0.77% |
| Maj |
 |
4,019 |
10.06% |
| Turn |
 |
39,955 |
71.81% |
|
|
 |
|
Liberal Democrat
|
| Con |
 |
8,452 |
21.90% |
| Lab |
 |
7,296 |
18.90% |
| LD |
 |
14,957 |
38.70% |
| SNP |
 |
7,276 |
18.80% |
| Oth |
 |
688 |
1.80% |
| Maj |
 |
6,505 |
16.80% |
| Turn |
 |
38,669 |
73.22% |
|
|
 |
|

|

