|
Rother Valley
Labour hold

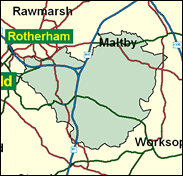
Rather like the Don Valley seat surrounds Doncaster, Rother Valley has traditionally wrapped itself around Rotherham like a red blanket. It consists of the south-eastern part of the Metropolitan Borough of Rotherham, with a large number of small communities, mostly created by the coal mining of the South Yorkshire field: places such as Maltby, Dinnington, Kiveton Park and Thurcroft. There are some agricultural and private residential areas too, but there is something of a "neighbourhood effect" in operation; areas which might be Conservative in a more favourable environment are more reluctant to express that background when Labour is in a hegemonic situation. The Tories only polled 17pc here in a seat which is half middle class, and it is safe for Kevin Barron.

Kevin Barron, a one-time Scargillite miner, elected here in 1993, progressively distanced himself from his former mentor to the extent of losing his NUM sponsorship, and co-running the campaign backing Blair's Clause Four redraft in 1995. Once-rising as PPS to Neil Kinnock (1985-88), his career levelled-out as a Health spokesman dropped on the morrow of victory in 1997, having earlier failed in a bid to become Chief Whip. Known now as a campaigner against tobacco advertising, even he has loyally accepted delays in implementing a ban on Formula One. Helplessly too, he otherwise understandably bemoans a dead coalfield.
 |
| Wealthy Achievers, Suburban Areas |
10.04% |
14.99% |
66.98 |
|
| Affluent Greys, Rural Communities |
0.00% |
2.13% |
0.00 |
|
| Prosperous Pensioners, Retirement Areas |
0.00% |
2.49% |
0.00 |
|
| Affluent Executives, Family Areas |
3.29% |
4.43% |
74.40 |
|
| Well-Off Workers, Family Areas |
19.96% |
7.27% |
274.46 |
|
| Affluent Urbanites, Town & City Areas |
0.18% |
2.56% |
7.03 |
|
| Prosperous Professionals, Metropolitan Areas |
0.00% |
2.04% |
0.00 |
|
| Better-Off Executives, Inner City Areas |
0.00% |
3.94% |
0.00 |
|
| Comfortable Middle Agers, Mature Home Owning Areas |
11.72% |
13.04% |
89.88 |
|
| Skilled Workers, Home Owning Areas |
19.34% |
12.70% |
152.24 |
|
| New Home Owners, Mature Communities |
21.16% |
8.14% |
259.81 |
|
| White Collar Workers, Better-Off Multi Ethnic Areas |
0.00% |
4.02% |
0.00 |
|
| Older People, Less Prosperous Areas |
4.46% |
3.19% |
140.01 |
|
| Council Estate Residents, Better-Off Homes |
8.81% |
11.31% |
77.90 |
|
| Council Estate Residents, High Unemployment |
0.00% |
3.06% |
0.14 |
|
| Council Estate Residents, Greatest Hardship |
1.03% |
2.52% |
40.87 |
|
| People in Multi-Ethnic, Low-Income Areas |
0.00% |
2.10% |
0.00 |
|
| Unclassified |
0.00% |
0.06% |
1.77 |
|
|
 |
 |
 |
| £0-5K |
11.38% |
9.41% |
120.91 |
|
| £5-10K |
19.63% |
16.63% |
118.03 |
|
| £10-15K |
18.66% |
16.58% |
112.57 |
|
| £15-20K |
14.41% |
13.58% |
106.12 |
|
| £20-25K |
10.34% |
10.39% |
99.51 |
|
| £25-30K |
7.24% |
7.77% |
93.12 |
|
| £30-35K |
5.05% |
5.79% |
87.13 |
|
| £35-40K |
3.54% |
4.33% |
81.61 |
|
| £40-45K |
2.50% |
3.27% |
76.58 |
|
| £45-50K |
1.79% |
2.48% |
72.00 |
|
| £50-55K |
1.29% |
1.90% |
67.87 |
|
| £55-60K |
0.95% |
1.47% |
64.13 |
|
| £60-65K |
0.70% |
1.15% |
60.74 |
|
| £65-70K |
0.52% |
0.91% |
57.68 |
|
| £70-75K |
0.39% |
0.72% |
54.91 |
|
| £75-80K |
0.30% |
0.57% |
52.39 |
|
| £80-85K |
0.23% |
0.46% |
50.11 |
|
| £85-90K |
0.18% |
0.37% |
48.02 |
|
| £90-95K |
0.14% |
0.31% |
46.11 |
|
| £95-100K |
0.11% |
0.25% |
44.37 |
|
| £100K + |
0.49% |
1.34% |
36.47 |
|
|
|

|


|
1992-1997
|
1997-2001
|
|
|
|
| Con |
-10.22% |
| Lab |
7.06% |
| LD |
-1.13% |
|
| Con |
4.97% |
| Lab |
-5.47% |
| LD |
0.93% |
|
|
 |
Kevin Barron
Labour hold
|
| Con |
 |
7,969 |
21.65% |
| Lab |
 |
22,851 |
62.09% |
| LD |
 |
4,603 |
12.51% |
| Oth |
 |
1,380 |
3.75% |
| Maj |
 |
14,882 |
40.44% |
| Turn |
 |
36,803 |
53.20% |
|
|
 |
Kevin Barron
Labour hold
|
| L |
Kevin Barron |
22,851 |
62.09% |
| UK |
David Cutts |
1,380 |
3.75% |
| C |
James Duddridge |
7,969 |
21.65% |
| LD |
Win Knight |
4,603 |
12.51% |
|
Candidates representing 4 parties stood for election to this seat.
|
|
 |
Kevin Barron
Labour
|
| Con |
 |
7,699 |
16.68% |
| Lab |
 |
31,184 |
67.56% |
| LD |
 |
5,342 |
11.57% |
| Ref |
 |
1,932 |
4.19% |
| Oth |
|
0 |
0.00% |
| Maj |
 |
23,485 |
50.88% |
| Turn |
 |
46,157 |
67.26% |
|
|
 |
|
Labour
|
| Con |
 |
13,755 |
26.90% |
| Lab |
 |
30,977 |
60.50% |
| LD |
 |
6,483 |
12.70% |
| Oth |
|
0 |
0.00% |
| Maj |
 |
17,222 |
33.60% |
| Turn |
 |
51,215 |
74.70% |
|
|
 |
|

|

