|
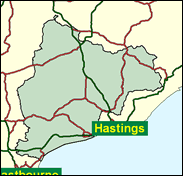
Bexhill & Battle
Conservative hold

This seat will remain safely Conservative, but with a new candidate - Greg Barker, who was subject to a very belated internal local party challenge on the basis of alleged magnified business qualifications just before Easter 2001 - after Charles Wardle announced his retirement in early 2000 following revelations of a well-paid extra-parliamentary consultancy from Mohamed Fayed, the owner of Harrods. Nearly half of all votes will probably be cast by pensioners in this East Sussex constituency, since they form more than a third of the electorate and turn out more enthusiastically than other voters. The Tories did not quite obtain an absolute majority of all votes cast in 1997, but the Referendum candidate saved her deposit. This year the leader of the UK Independence Party, Nigel Farage, opted to stand in this constituency, reportedly with the backing not only of some of Wardle's supporters, but, after 11 May, of the most recent MP himself.

Gregory Barker has replaced as Conservative candidate, the quit-before-pushed MP Charles Wardle, who lost local party support over his paid consultancy with Mohamed Fayed. Additionally, although Barker, born 1966 and educated at Steyning Grammar School, Lancing College, Royal Holloway College London University, and the London Business School, came well-connected to the Tory right as adviser to David Willetts and Chairman of the Centre for Policy Studies policy group, Agenda 2000, his impressive portfolio of past and present business activities covering advertising, oil and banking, have become a source of dispute within the Constituency Association, with allegations of "exaggeration". Though this seat was the Conservatives' 18th safest in 1997, the Liberal Democrats' Stephen Hardy, a 52 year-old local councillor, Cambridge graduate, local brick company director, and opponent of local mobile phone masts, will hope to exploit any disaffection caused by Charles Wardle's departure, and Gregory Barker's arrival.
 |
| Wealthy Achievers, Suburban Areas |
24.05% |
14.99% |
160.42 |
|
| Affluent Greys, Rural Communities |
3.05% |
2.13% |
143.22 |
|
| Prosperous Pensioners, Retirement Areas |
35.44% |
2.49% |
1,425.28 |
|
| Affluent Executives, Family Areas |
0.59% |
4.43% |
13.25 |
|
| Well-Off Workers, Family Areas |
1.26% |
7.27% |
17.27 |
|
| Affluent Urbanites, Town & City Areas |
0.25% |
2.56% |
9.81 |
|
| Prosperous Professionals, Metropolitan Areas |
0.00% |
2.04% |
0.00 |
|
| Better-Off Executives, Inner City Areas |
1.00% |
3.94% |
25.43 |
|
| Comfortable Middle Agers, Mature Home Owning Areas |
20.30% |
13.04% |
155.66 |
|
| Skilled Workers, Home Owning Areas |
0.72% |
12.70% |
5.64 |
|
| New Home Owners, Mature Communities |
8.33% |
8.14% |
102.25 |
|
| White Collar Workers, Better-Off Multi Ethnic Areas |
2.00% |
4.02% |
49.76 |
|
| Older People, Less Prosperous Areas |
0.98% |
3.19% |
30.74 |
|
| Council Estate Residents, Better-Off Homes |
2.02% |
11.31% |
17.87 |
|
| Council Estate Residents, High Unemployment |
0.00% |
3.06% |
0.00 |
|
| Council Estate Residents, Greatest Hardship |
0.00% |
2.52% |
0.00 |
|
| People in Multi-Ethnic, Low-Income Areas |
0.00% |
2.10% |
0.00 |
|
| Unclassified |
0.03% |
0.06% |
48.48 |
|
|
 |
|
|
| £0-5K |
9.84% |
9.41% |
104.58 |
|
| £5-10K |
17.31% |
16.63% |
104.08 |
|
| £10-15K |
17.12% |
16.58% |
103.26 |
|
| £15-20K |
13.84% |
13.58% |
101.93 |
|
| £20-25K |
10.43% |
10.39% |
100.33 |
|
| £25-30K |
7.67% |
7.77% |
98.68 |
|
| £30-35K |
5.62% |
5.79% |
97.10 |
|
| £35-40K |
4.14% |
4.33% |
95.63 |
|
| £40-45K |
3.08% |
3.27% |
94.29 |
|
| £45-50K |
2.31% |
2.48% |
93.09 |
|
| £50-55K |
1.75% |
1.90% |
92.02 |
|
| £55-60K |
1.34% |
1.47% |
91.07 |
|
| £60-65K |
1.04% |
1.15% |
90.23 |
|
| £65-70K |
0.81% |
0.91% |
89.49 |
|
| £70-75K |
0.64% |
0.72% |
88.83 |
|
| £75-80K |
0.51% |
0.57% |
88.25 |
|
| £80-85K |
0.41% |
0.46% |
87.73 |
|
| £85-90K |
0.33% |
0.37% |
87.27 |
|
| £90-95K |
0.27% |
0.31% |
86.87 |
|
| £95-100K |
0.22% |
0.25% |
86.51 |
|
| £100K + |
1.15% |
1.34% |
85.31 |
|
|
|
|


|
1992-1997
|
1997-2001
|
|
|
|
| Con |
-12.19% |
| Lab |
8.70% |
| LD |
-3.45% |
|
| Con |
0.02% |
| Lab |
1.34% |
| LD |
-0.77% |
|
|
|
Greg Barker
Conservative hold
|
| Con |
 |
21,555 |
48.13% |
| Lab |
 |
8,702 |
19.43% |
| LD |
 |
11,052 |
24.68% |
| Oth |
 |
3,474 |
7.76% |
| Maj |
 |
10,503 |
23.45% |
| Turn |
|
44,783 |
64.89% |
|
|
|
Greg Barker
Conservative hold
|
| C |
Greg Barker |
21,555 |
48.13% |
| UK |
Nigel Farage |
3,474 |
7.76% |
| LD |
Stephen Hardy |
11,052 |
24.68% |
| L |
Anne Moore-Williams |
8,702 |
19.43% |
|
Candidates representing 4 parties stood for election to this seat.
|
|
|
Charles Wardle
Conservative
|
| Con |
|
23,570 |
48.11% |
| Lab |
|
8,866 |
18.10% |
| LD |
|
12,470 |
25.45% |
| Ref |
 |
3,302 |
6.74% |
| Oth |
|
786 |
1.60% |
| Maj |
|
11,100 |
22.66% |
| Turn |
|
48,994 |
74.70% |
|
|
|
|
Conservative
|
| Con |
|
31,347 |
60.30% |
| Lab |
|
4,877 |
9.40% |
| LD |
|
15,007 |
28.90% |
| Oth |
|
784 |
1.50% |
| Maj |
|
16,340 |
31.40% |
| Turn |
|
52,015 |
78.62% |
|
|
|
|
|