|
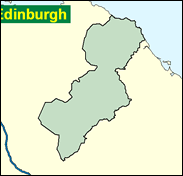
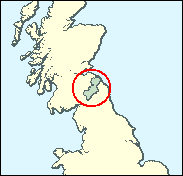
Roxburgh & Berwickshire
Liberal Democrat hold

That part of David Steel's original seat (Roxburgh, Selkirk and Peebles) that he didn't stay with when the Scottish Borders divisions were redrawn in 1983 has now shown that it can elect other Liberal Democrats in both Westminster (Archy Kirkwood) and Holyrood (Euan Robson) parliaments. What is more, the seat is now safer than the one Steel did choose (Tweeddale, Ettrick and Lauderdale).

Archy Kirkwood, unusually a Liberal Democrat MP from a Labour-voting working class background, and who initially himself had Labour affiliations, was elected here in 1983. Born 1946 and educated at Cranhill Senior Secondary School, Glasgow and Heriot Watt University, he worked as a solicitor at Hawick in David Steel's Borders constituency until inheriting this part of it. A specialist on social security policy, now retreated into the non-partisan realm of select committee chairmanship, he was for five years his Party's Chief Whip. Somewhat cadaverous-looking, he votes with the countryside lobby against fox hunting bans.
 |
| Wealthy Achievers, Suburban Areas |
3.71% |
14.99% |
24.76 |
|
| Affluent Greys, Rural Communities |
14.16% |
2.13% |
665.95 |
|
| Prosperous Pensioners, Retirement Areas |
1.23% |
2.49% |
49.58 |
|
| Affluent Executives, Family Areas |
0.00% |
4.43% |
0.00 |
|
| Well-Off Workers, Family Areas |
2.76% |
7.27% |
37.91 |
|
| Affluent Urbanites, Town & City Areas |
0.00% |
2.56% |
0.00 |
|
| Prosperous Professionals, Metropolitan Areas |
0.00% |
2.04% |
0.00 |
|
| Better-Off Executives, Inner City Areas |
0.36% |
3.94% |
9.00 |
|
| Comfortable Middle Agers, Mature Home Owning Areas |
11.05% |
13.04% |
84.75 |
|
| Skilled Workers, Home Owning Areas |
11.13% |
12.70% |
87.59 |
|
| New Home Owners, Mature Communities |
12.37% |
8.14% |
151.90 |
|
| White Collar Workers, Better-Off Multi Ethnic Areas |
1.75% |
4.02% |
43.51 |
|
| Older People, Less Prosperous Areas |
11.78% |
3.19% |
369.84 |
|
| Council Estate Residents, Better-Off Homes |
21.03% |
11.31% |
185.89 |
|
| Council Estate Residents, High Unemployment |
6.59% |
3.06% |
215.06 |
|
| Council Estate Residents, Greatest Hardship |
2.09% |
2.52% |
83.11 |
|
| People in Multi-Ethnic, Low-Income Areas |
0.00% |
2.10% |
0.00 |
|
| Unclassified |
0.00% |
0.06% |
0.00 |
|
|
 |
 |
 |
| £0-5K |
10.37% |
9.41% |
110.16 |
|
| £5-10K |
19.92% |
16.63% |
119.75 |
|
| £10-15K |
19.31% |
16.58% |
116.50 |
|
| £15-20K |
14.80% |
13.58% |
108.97 |
|
| £20-25K |
10.46% |
10.39% |
100.64 |
|
| £25-30K |
7.21% |
7.77% |
92.78 |
|
| £30-35K |
4.97% |
5.79% |
85.77 |
|
| £35-40K |
3.45% |
4.33% |
79.66 |
|
| £40-45K |
2.43% |
3.27% |
74.39 |
|
| £45-50K |
1.73% |
2.48% |
69.85 |
|
| £50-55K |
1.26% |
1.90% |
65.93 |
|
| £55-60K |
0.92% |
1.47% |
62.54 |
|
| £60-65K |
0.69% |
1.15% |
59.61 |
|
| £65-70K |
0.52% |
0.91% |
57.05 |
|
| £70-75K |
0.39% |
0.72% |
54.82 |
|
| £75-80K |
0.30% |
0.57% |
52.85 |
|
| £80-85K |
0.24% |
0.46% |
51.13 |
|
| £85-90K |
0.19% |
0.37% |
49.60 |
|
| £90-95K |
0.15% |
0.31% |
48.24 |
|
| £95-100K |
0.12% |
0.25% |
47.03 |
|
| £100K + |
0.57% |
1.34% |
42.07 |
|
|
|

|


|
1992-1997
|
1997-2001
|
|
|
|
| Con |
-10.33% |
| Lab |
6.16% |
| LD |
0.00% |
| SNP |
0.73% |
|
| Con |
-1.18% |
| Lab |
0.66% |
| LD |
2.27% |
| SNP |
-1.59% |
|
|
 |
Archy Kirkwood
Liberal Democrat hold
|
| Con |
 |
6,533 |
22.69% |
| Lab |
 |
4,498 |
15.62% |
| LD |
 |
14,044 |
48.77% |
| SNP |
 |
2,806 |
9.74% |
| Oth |
 |
916 |
3.18% |
| Maj |
 |
7,511 |
26.08% |
| Turn |
 |
28,797 |
61.19% |
|
|
 |
Archy Kirkwood
Liberal Democrat hold
|
| SNP |
Roderick Campbell |
2,806 |
9.74% |
| LD |
Archy Kirkwood |
14,044 |
48.77% |
| L |
Catherine Maxwell-Stuart |
4,498 |
15.62% |
| SSP |
Amanda Millar |
463 |
1.61% |
| UK |
Peter Neilson |
453 |
1.57% |
| C |
George Turnball |
6,533 |
22.69% |
|
Candidates representing 6 parties stood for election to this seat.
|
|
 |
Archy Kirkwood
Liberal Democrat
|
| Con |
 |
8,337 |
23.87% |
| Lab |
 |
5,226 |
14.96% |
| LD |
 |
16,243 |
46.50% |
| SNP |
 |
3,959 |
11.33% |
| Ref |
 |
922 |
2.64% |
| Oth |
 |
244 |
0.70% |
| Maj |
 |
7,906 |
22.63% |
| Turn |
 |
34,931 |
73.91% |
|
|
 |
|
Liberal Democrat
|
| Con |
 |
12,354 |
34.20% |
| Lab |
 |
3,167 |
8.80% |
| LD |
 |
16,807 |
46.50% |
| SNP |
 |
3,844 |
10.60% |
| Oth |
|
0 |
0.00% |
| Maj |
 |
4,453 |
12.30% |
| Turn |
 |
36,172 |
76.85% |
|
|
 |
|

|

