|
Rugby & Kenilworth
Labour hold

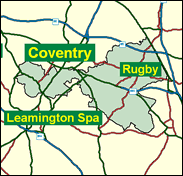
This was one of the most unexpected Labour gains of 1997 and will surely be one of the first to return. Not only is the Rugby section far from secure for them, apart from a few wards in the centre of the eponymous town, but they have never got, and one is tempted to say will never extract significant support from the affluent Coventry commuting town of Kenilworth. This is the Tories fourth most likely gain when considering the 1997 General Election results, no 16 when looking at the 1999 Euro-list, and little better when considering recent local government elections. Labour will only hold it if they do as well as last time.

Andy King, a Catholic Scotsman dropped in here, after eight years a local county councillor, in May 1997. A mechanic and postal worker-turned-social work manager, he was born 1948 and educated at St John the Baptist School, Uddington, Lancashire, Coatbridge Technical College, Nene College Northampton, and Hatfield Polytechnic. Very unobtrusive as an MP, his unexpected arrival in 1997 ought to be followed by his expected exit in 2001. The Conservatives have chosen one of their migrant ex-MPs to fight here: David Martin, who sat for Portsmouth South from 1987 to 1997. A barrister, he was born in 1945, educated at Kelly College, Tavistock and Fitzwilliam College, Cambridge. A free-market rightwinger who has backed abolition of the net book agreement, rail privatisation and Rent Act repeal, he quit as Douglas Hurd's PPS over foot-dragging on Post Office privatisation. Used to marginal seats, his career was previously plagued by the Liberals: he lost Yeovil to Paddy Ashdown in 1983; recaptured Portsmouth South from the Liberals in 1983, only to lose it back to them in 1997. For all that trouble he is now one of the few ex-MPs allowed to 'chicken-run' miles from their former seats.
 |
| Wealthy Achievers, Suburban Areas |
25.54% |
14.99% |
170.31 |
|
| Affluent Greys, Rural Communities |
0.03% |
2.13% |
1.53 |
|
| Prosperous Pensioners, Retirement Areas |
1.15% |
2.49% |
46.35 |
|
| Affluent Executives, Family Areas |
7.59% |
4.43% |
171.51 |
|
| Well-Off Workers, Family Areas |
7.57% |
7.27% |
104.12 |
|
| Affluent Urbanites, Town & City Areas |
1.81% |
2.56% |
70.55 |
|
| Prosperous Professionals, Metropolitan Areas |
0.37% |
2.04% |
18.13 |
|
| Better-Off Executives, Inner City Areas |
0.56% |
3.94% |
14.17 |
|
| Comfortable Middle Agers, Mature Home Owning Areas |
19.30% |
13.04% |
148.01 |
|
| Skilled Workers, Home Owning Areas |
15.33% |
12.70% |
120.68 |
|
| New Home Owners, Mature Communities |
7.52% |
8.14% |
92.30 |
|
| White Collar Workers, Better-Off Multi Ethnic Areas |
2.36% |
4.02% |
58.70 |
|
| Older People, Less Prosperous Areas |
2.02% |
3.19% |
63.57 |
|
| Council Estate Residents, Better-Off Homes |
6.41% |
11.31% |
56.65 |
|
| Council Estate Residents, High Unemployment |
1.58% |
3.06% |
51.61 |
|
| Council Estate Residents, Greatest Hardship |
0.86% |
2.52% |
34.12 |
|
| People in Multi-Ethnic, Low-Income Areas |
0.00% |
2.10% |
0.00 |
|
| Unclassified |
0.00% |
0.06% |
0.00 |
|
|
 |
 |
 |
| £0-5K |
7.70% |
9.41% |
81.78 |
|
| £5-10K |
14.62% |
16.63% |
87.91 |
|
| £10-15K |
15.68% |
16.58% |
94.60 |
|
| £15-20K |
13.62% |
13.58% |
100.28 |
|
| £20-25K |
10.89% |
10.39% |
104.79 |
|
| £25-30K |
8.42% |
7.77% |
108.29 |
|
| £30-35K |
6.43% |
5.79% |
110.98 |
|
| £35-40K |
4.90% |
4.33% |
113.01 |
|
| £40-45K |
3.74% |
3.27% |
114.54 |
|
| £45-50K |
2.87% |
2.48% |
115.65 |
|
| £50-55K |
2.22% |
1.90% |
116.43 |
|
| £55-60K |
1.72% |
1.47% |
116.95 |
|
| £60-65K |
1.35% |
1.15% |
117.26 |
|
| £65-70K |
1.06% |
0.91% |
117.40 |
|
| £70-75K |
0.84% |
0.72% |
117.39 |
|
| £75-80K |
0.67% |
0.57% |
117.27 |
|
| £80-85K |
0.54% |
0.46% |
117.06 |
|
| £85-90K |
0.44% |
0.37% |
116.77 |
|
| £90-95K |
0.36% |
0.31% |
116.41 |
|
| £95-100K |
0.29% |
0.25% |
116.01 |
|
| £100K + |
1.51% |
1.34% |
112.13 |
|
|
|

|


|
1992-1997
|
1997-2001
|
|
|
|
| Con |
-10.15% |
| Lab |
11.06% |
| LD |
-1.03% |
|
| Con |
-2.58% |
| Lab |
1.96% |
| LD |
-0.44% |
|
|
 |
Andrew King
Labour hold
|
| Con |
 |
21,344 |
39.68% |
| Lab |
 |
24,221 |
45.02% |
| LD |
 |
7,444 |
13.84% |
| Oth |
 |
787 |
1.46% |
| Maj |
 |
2,877 |
5.35% |
| Turn |
 |
53,796 |
67.44% |
|
|
 |
Andrew King
Labour hold
|
| LD |
Gwen Fairweather |
7,444 |
13.84% |
| UK |
Paul Garratt |
787 |
1.46% |
| L |
Andrew King |
24,221 |
45.02% |
| C |
David Martin |
21,344 |
39.68% |
|
Candidates representing 4 parties stood for election to this seat.
|
|
 |
Andy King
Labour gain
|
| Con |
 |
25,861 |
42.25% |
| Lab |
 |
26,356 |
43.06% |
| LD |
 |
8,737 |
14.27% |
| Ref |
|
0 |
0.00% |
| Oth |
 |
251 |
0.41% |
| Maj |
 |
495 |
0.81% |
| Turn |
 |
61,205 |
77.10% |
|
|
 |
|
Conservative
|
| Con |
 |
34,218 |
52.40% |
| Lab |
 |
20,894 |
32.00% |
| LD |
 |
9,971 |
15.30% |
| Oth |
 |
202 |
0.30% |
| Maj |
 |
13,324 |
20.40% |
| Turn |
 |
65,285 |
83.02% |
|
|
 |
|

|

