|
Ruislip - Northwood
Conservative hold

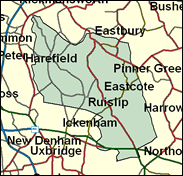
The north western fringe of London, and the northernmost third of the Borough of Hillingdon, is the site for the fourth safest Conservative seat in Greater London. It is blessed with the name of Ruislip, which stands for many for the epitome of conventional suburbia ("Tropic of Ruislip"; The Good Life was filmed here). It would probably not have been quite so far up the list of Conservative safe seats if John Wilkinson had not been one of the Maastricht Eurosceptic rebels and thus immune from a Referendum party or UKIP candidature. But this cannot be said to have saved him. The seat is 70pc middle class, 77pc owner occupied, and died in the wool Tory. It really wouldn't think of electing any other party.

John Wilkinson, one of the Conservatives' 15 Old Etonian MPs, was first elected here in 1979, though had been an MP in Bradford from 1970 to 1974. Pink-faced and boyish-looking notwithstanding his age (he was born in 1940), he attended Cranwell and Churchill College Cambridge after Eton, and served in the RAF for five years, whence his expertise in defence-related matters and his preference for American over European links. A Europhile-turned-Eurosceptic, he was one of eight Tories to lose the Whip over rebel-voting on Europe in 1994. Threatened in his local party for this dissidence, he nevertheless also called for an elected House of Lords and backed an elected London Assembly, again opposing the official Party line, and has been described as "intense and unyielding" and "decent but somewhat obscure".
 |
| Wealthy Achievers, Suburban Areas |
23.45% |
14.99% |
156.41 |
|
| Affluent Greys, Rural Communities |
0.00% |
2.13% |
0.00 |
|
| Prosperous Pensioners, Retirement Areas |
4.06% |
2.49% |
163.14 |
|
| Affluent Executives, Family Areas |
0.88% |
4.43% |
19.78 |
|
| Well-Off Workers, Family Areas |
2.83% |
7.27% |
38.92 |
|
| Affluent Urbanites, Town & City Areas |
7.41% |
2.56% |
288.74 |
|
| Prosperous Professionals, Metropolitan Areas |
6.47% |
2.04% |
317.18 |
|
| Better-Off Executives, Inner City Areas |
0.27% |
3.94% |
6.96 |
|
| Comfortable Middle Agers, Mature Home Owning Areas |
30.91% |
13.04% |
237.06 |
|
| Skilled Workers, Home Owning Areas |
14.96% |
12.70% |
117.77 |
|
| New Home Owners, Mature Communities |
4.24% |
8.14% |
52.09 |
|
| White Collar Workers, Better-Off Multi Ethnic Areas |
1.24% |
4.02% |
30.74 |
|
| Older People, Less Prosperous Areas |
1.95% |
3.19% |
61.25 |
|
| Council Estate Residents, Better-Off Homes |
0.72% |
11.31% |
6.37 |
|
| Council Estate Residents, High Unemployment |
0.56% |
3.06% |
18.29 |
|
| Council Estate Residents, Greatest Hardship |
0.00% |
2.52% |
0.00 |
|
| People in Multi-Ethnic, Low-Income Areas |
0.05% |
2.10% |
2.49 |
|
| Unclassified |
0.00% |
0.06% |
0.00 |
|
|
 |
 |
 |
| £0-5K |
3.77% |
9.41% |
40.08 |
|
| £5-10K |
8.86% |
16.63% |
53.29 |
|
| £10-15K |
11.59% |
16.58% |
69.90 |
|
| £15-20K |
11.87% |
13.58% |
87.37 |
|
| £20-25K |
10.85% |
10.39% |
104.41 |
|
| £25-30K |
9.36% |
7.77% |
120.42 |
|
| £30-35K |
7.83% |
5.79% |
135.14 |
|
| £35-40K |
6.43% |
4.33% |
148.52 |
|
| £40-45K |
5.24% |
3.27% |
160.58 |
|
| £45-50K |
4.26% |
2.48% |
171.44 |
|
| £50-55K |
3.45% |
1.90% |
181.19 |
|
| £55-60K |
2.80% |
1.47% |
189.95 |
|
| £60-65K |
2.28% |
1.15% |
197.84 |
|
| £65-70K |
1.86% |
0.91% |
204.95 |
|
| £70-75K |
1.52% |
0.72% |
211.38 |
|
| £75-80K |
1.25% |
0.57% |
217.21 |
|
| £80-85K |
1.03% |
0.46% |
222.50 |
|
| £85-90K |
0.85% |
0.37% |
227.32 |
|
| £90-95K |
0.71% |
0.31% |
231.73 |
|
| £95-100K |
0.59% |
0.25% |
235.76 |
|
| £100K + |
3.41% |
1.34% |
253.73 |
|
|
|

|


|
1992-1997
|
1997-2001
|
|
|
|
| Con |
-12.66% |
| Lab |
12.96% |
| LD |
-0.46% |
|
| Con |
-1.47% |
| Lab |
-4.38% |
| LD |
3.09% |
|
|
 |
John Wilkinson
Conservative hold
|
| Con |
 |
18,115 |
48.77% |
| Lab |
 |
10,578 |
28.48% |
| LD |
 |
7,177 |
19.32% |
| Oth |
 |
1,271 |
3.42% |
| Maj |
 |
7,537 |
20.29% |
| Turn |
 |
37,141 |
61.10% |
|
|
 |
John Wilkinson
Conservative hold
|
| LD |
Mike Cox |
7,177 |
19.32% |
| BNP |
Ian Edward |
547 |
1.47% |
| G |
Graham Lee |
724 |
1.95% |
| L |
Gillian Travis |
10,578 |
28.48% |
| C |
John Wilkinson |
18,115 |
48.77% |
|
Candidates representing 5 parties stood for election to this seat.
|
|
 |
John Wilkinson
Conservative
|
| Con |
 |
22,526 |
50.24% |
| Lab |
 |
14,732 |
32.86% |
| LD |
 |
7,279 |
16.24% |
| Ref |
|
0 |
0.00% |
| Oth |
 |
296 |
0.66% |
| Maj |
 |
7,794 |
17.38% |
| Turn |
 |
44,833 |
74.24% |
|
|
 |
|
Conservative
|
| Con |
 |
30,130 |
62.90% |
| Lab |
 |
9,521 |
19.90% |
| LD |
 |
7,981 |
16.70% |
| Oth |
 |
294 |
0.60% |
| Maj |
 |
20,609 |
43.00% |
| Turn |
 |
47,926 |
78.06% |
|
|
 |
|

|

