|
Runnymede & Weybridge
Conservative hold

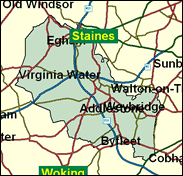
Magna Carta was not the declaration of people's rights that so many, including hordes of American tourists, believe. If anything it was a charter for early thirteenth Century baronial privilege. It would perhaps be unkind to suggest that Runnymede is placed appropriately enough now in a very wealthy and privileged part of an elite property owning county in the most prosperous and dominant region of England. But even after a swing of 13pc here in Weybridge and Egham, Englefield Green and Virginia Water, the Conservatives still held off the challenge of the Labour party by nearly 10,000 votes in 1997. If there is any uprising it will be against the taxes and other depredations of a New Labour government.

Philip Hammond, a Health spokesman, was elected here in 1997. A somewhat cadaverous-looking management consultant and small manufacturer of medical equipment, he was Essex-born in 1955 and attended Shenfield School, Brentwood, before progressing to University College Oxford. Relatively unpartisan, he has been rather mercilessly mocked as resembling a "Moss-Bros 'suits-you-sir' sales assistant" (Matthew Parris) and admits to being a non-golfer in a seat littered with golfing facilities.
 |
| Wealthy Achievers, Suburban Areas |
37.09% |
14.99% |
247.34 |
|
| Affluent Greys, Rural Communities |
0.00% |
2.13% |
0.00 |
|
| Prosperous Pensioners, Retirement Areas |
2.14% |
2.49% |
86.03 |
|
| Affluent Executives, Family Areas |
4.82% |
4.43% |
108.85 |
|
| Well-Off Workers, Family Areas |
7.89% |
7.27% |
108.41 |
|
| Affluent Urbanites, Town & City Areas |
7.90% |
2.56% |
307.91 |
|
| Prosperous Professionals, Metropolitan Areas |
3.27% |
2.04% |
160.30 |
|
| Better-Off Executives, Inner City Areas |
0.43% |
3.94% |
10.91 |
|
| Comfortable Middle Agers, Mature Home Owning Areas |
20.73% |
13.04% |
158.95 |
|
| Skilled Workers, Home Owning Areas |
1.30% |
12.70% |
10.22 |
|
| New Home Owners, Mature Communities |
6.19% |
8.14% |
76.00 |
|
| White Collar Workers, Better-Off Multi Ethnic Areas |
1.12% |
4.02% |
27.77 |
|
| Older People, Less Prosperous Areas |
2.10% |
3.19% |
66.03 |
|
| Council Estate Residents, Better-Off Homes |
4.20% |
11.31% |
37.10 |
|
| Council Estate Residents, High Unemployment |
0.72% |
3.06% |
23.55 |
|
| Council Estate Residents, Greatest Hardship |
0.00% |
2.52% |
0.00 |
|
| People in Multi-Ethnic, Low-Income Areas |
0.00% |
2.10% |
0.00 |
|
| Unclassified |
0.13% |
0.06% |
200.86 |
|
|
 |
 |
 |
| £0-5K |
4.17% |
9.41% |
44.35 |
|
| £5-10K |
8.97% |
16.63% |
53.91 |
|
| £10-15K |
11.26% |
16.58% |
67.93 |
|
| £15-20K |
11.37% |
13.58% |
83.70 |
|
| £20-25K |
10.39% |
10.39% |
99.97 |
|
| £25-30K |
9.02% |
7.77% |
116.08 |
|
| £30-35K |
7.62% |
5.79% |
131.63 |
|
| £35-40K |
6.34% |
4.33% |
146.44 |
|
| £40-45K |
5.24% |
3.27% |
160.40 |
|
| £45-50K |
4.31% |
2.48% |
173.48 |
|
| £50-55K |
3.54% |
1.90% |
185.69 |
|
| £55-60K |
2.91% |
1.47% |
197.07 |
|
| £60-65K |
2.39% |
1.15% |
207.67 |
|
| £65-70K |
1.97% |
0.91% |
217.54 |
|
| £70-75K |
1.63% |
0.72% |
226.72 |
|
| £75-80K |
1.35% |
0.57% |
235.28 |
|
| £80-85K |
1.13% |
0.46% |
243.25 |
|
| £85-90K |
0.94% |
0.37% |
250.69 |
|
| £90-95K |
0.79% |
0.31% |
257.64 |
|
| £95-100K |
0.66% |
0.25% |
264.14 |
|
| £100K + |
3.97% |
1.34% |
295.72 |
|
|
|

|


|
1992-1997
|
1997-2001
|
|
|
|
| Con |
-12.81% |
| Lab |
13.43% |
| LD |
-4.81% |
|
| Con |
0.08% |
| Lab |
-0.47% |
| LD |
0.03% |
|
|
 |
Philip Hammond
Conservative hold
|
| Con |
 |
20,646 |
48.66% |
| Lab |
 |
12,286 |
28.96% |
| LD |
 |
6,924 |
16.32% |
| Oth |
 |
2,570 |
6.06% |
| Maj |
 |
8,360 |
19.70% |
| Turn |
 |
42,426 |
56.14% |
|
|
 |
Philip Hammond
Conservative hold
|
| L |
Jane Briginshaw |
12,286 |
28.96% |
| UK |
Christopher Browne |
1,332 |
3.14% |
| LD |
Chris Bushill |
6,924 |
16.32% |
| G |
Charles Gilman |
1,238 |
2.92% |
| C |
Philip Hammond |
20,646 |
48.66% |
|
Candidates representing 5 parties stood for election to this seat.
|
|
 |
Philip Hammond
Conservative
|
| Con |
 |
25,051 |
48.59% |
| Lab |
 |
15,176 |
29.43% |
| LD |
 |
8,397 |
16.29% |
| Ref |
 |
2,150 |
4.17% |
| Oth |
 |
787 |
1.53% |
| Maj |
 |
9,875 |
19.15% |
| Turn |
 |
51,561 |
71.44% |
|
|
 |
|
Conservative
|
| Con |
 |
34,645 |
61.40% |
| Lab |
 |
9,004 |
16.00% |
| LD |
 |
11,905 |
21.10% |
| Oth |
 |
878 |
1.60% |
| Maj |
 |
22,740 |
40.30% |
| Turn |
 |
56,432 |
78.95% |
|
|
 |
|

|

