|
Rushcliffe
Conservative hold

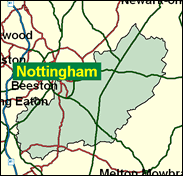
Kenneth Clarke's seat is the only Conservative division left in Nottinghamshire. It covers the south of the county, from rural villages through expanded desirable residential areas like Bingham, Radcliffe on Trent, Keyworth, East Leake and Ruddington to West Bridgford, just across the Trent from Nottingham, but including two of the sporting centrepieces of that proud city, the curiously named City ground of Nottingham Forest (Notts County's Meadow Lane is within the city boundaries!) and the Trent Bridge Test cricket arena. Nevertheless many of the residents of West Bridgford would probably be horrified to be included in the "red" city for parliamentary purposes, and are very comfortable with the emollient Clarke.

Kenneth Clarke, the Tories' big-hitter-in-exile, who combined being one of the more successful recent Conservative Chancellors with a reputation as "famously ignorant of economics" (Bryan Gould), was first elected here in 1970. A bright and breezy, ill-informed, opinionated barrister, welding a broad brush and flying by the seat of his pants, he emerged a One Nation Tory (born 1940) from a background including a Communist toolrooom engineer grandfather and an ex-pit electrician-cum-shopkeeping father, and attended Nottingham High School, and Gonville and Caius College, Cambridge, reading law as an entrée into Tory politics. Residually flat Nottingham-accented, he lost the Tory leadership election in 1997 despite an audacious alliance with Redwood which was compared with the Ribbentrop-Molotov Pact of 1939. His recall from Rushcliffe-les-deux-Eglises will come only when a party, blessed at its grass roots by many elderly Europhiles and at parliamentary level by sceptics of a broader age range, opts pragmatically for someone - anyone - who can win an election.
 |
| Wealthy Achievers, Suburban Areas |
50.05% |
14.99% |
333.83 |
|
| Affluent Greys, Rural Communities |
0.23% |
2.13% |
11.03 |
|
| Prosperous Pensioners, Retirement Areas |
2.92% |
2.49% |
117.62 |
|
| Affluent Executives, Family Areas |
10.13% |
4.43% |
228.87 |
|
| Well-Off Workers, Family Areas |
3.87% |
7.27% |
53.20 |
|
| Affluent Urbanites, Town & City Areas |
4.30% |
2.56% |
167.64 |
|
| Prosperous Professionals, Metropolitan Areas |
1.11% |
2.04% |
54.42 |
|
| Better-Off Executives, Inner City Areas |
2.42% |
3.94% |
61.27 |
|
| Comfortable Middle Agers, Mature Home Owning Areas |
11.85% |
13.04% |
90.88 |
|
| Skilled Workers, Home Owning Areas |
2.87% |
12.70% |
22.59 |
|
| New Home Owners, Mature Communities |
5.86% |
8.14% |
71.91 |
|
| White Collar Workers, Better-Off Multi Ethnic Areas |
0.35% |
4.02% |
8.77 |
|
| Older People, Less Prosperous Areas |
1.33% |
3.19% |
41.71 |
|
| Council Estate Residents, Better-Off Homes |
1.93% |
11.31% |
17.09 |
|
| Council Estate Residents, High Unemployment |
0.53% |
3.06% |
17.17 |
|
| Council Estate Residents, Greatest Hardship |
0.20% |
2.52% |
7.87 |
|
| People in Multi-Ethnic, Low-Income Areas |
0.00% |
2.10% |
0.00 |
|
| Unclassified |
0.05% |
0.06% |
82.08 |
|
|
 |
 |
 |
| £0-5K |
6.78% |
9.41% |
72.00 |
|
| £5-10K |
12.98% |
16.63% |
78.04 |
|
| £10-15K |
14.37% |
16.58% |
86.68 |
|
| £15-20K |
12.93% |
13.58% |
95.23 |
|
| £20-25K |
10.71% |
10.39% |
103.10 |
|
| £25-30K |
8.57% |
7.77% |
110.17 |
|
| £30-35K |
6.75% |
5.79% |
116.49 |
|
| £35-40K |
5.29% |
4.33% |
122.13 |
|
| £40-45K |
4.15% |
3.27% |
127.15 |
|
| £45-50K |
3.27% |
2.48% |
131.65 |
|
| £50-55K |
2.58% |
1.90% |
135.68 |
|
| £55-60K |
2.05% |
1.47% |
139.30 |
|
| £60-65K |
1.64% |
1.15% |
142.57 |
|
| £65-70K |
1.32% |
0.91% |
145.52 |
|
| £70-75K |
1.07% |
0.72% |
148.20 |
|
| £75-80K |
0.87% |
0.57% |
150.62 |
|
| £80-85K |
0.71% |
0.46% |
152.83 |
|
| £85-90K |
0.58% |
0.37% |
154.83 |
|
| £90-95K |
0.48% |
0.31% |
156.67 |
|
| £95-100K |
0.40% |
0.25% |
158.34 |
|
| £100K + |
2.22% |
1.34% |
165.41 |
|
|
|

|


|
1992-1997
|
1997-2001
|
|
|
|
| Con |
-10.03% |
| Lab |
13.03% |
| LD |
-5.75% |
|
| Con |
3.14% |
| Lab |
-2.23% |
| LD |
-0.67% |
|
|
 |
Kenneth Clarke
Conservative hold
|
| Con |
 |
25,869 |
47.51% |
| Lab |
 |
18,512 |
34.00% |
| LD |
 |
7,395 |
13.58% |
| Oth |
 |
2,670 |
4.90% |
| Maj |
 |
7,357 |
13.51% |
| Turn |
 |
54,446 |
66.53% |
|
|
 |
Kenneth Clarke
Conservative hold
|
| G |
Ashley Baxter |
1,236 |
2.27% |
| UK |
Ken Browne |
1,434 |
2.63% |
| C |
Kenneth Clarke |
25,869 |
47.51% |
| L |
Paul Fallon |
18,512 |
34.00% |
| LD |
Jeremy Hargreaves |
7,395 |
13.58% |
|
Candidates representing 5 parties stood for election to this seat.
|
|
 |
Kenneth Clarke
Conservative
|
| Con |
 |
27,558 |
44.37% |
| Lab |
 |
22,503 |
36.23% |
| LD |
 |
8,851 |
14.25% |
| Ref |
 |
2,682 |
4.32% |
| Oth |
 |
518 |
0.83% |
| Maj |
 |
5,055 |
8.14% |
| Turn |
 |
62,112 |
78.89% |
|
|
 |
|
Conservative
|
| Con |
 |
34,448 |
54.40% |
| Lab |
 |
14,682 |
23.20% |
| LD |
 |
12,660 |
20.00% |
| Oth |
 |
1,536 |
2.40% |
| Maj |
 |
19,766 |
31.20% |
| Turn |
 |
63,326 |
83.25% |
|
|
 |
|

|

