|
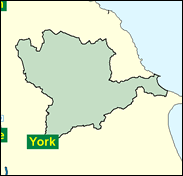
Ryedale
Conservative hold

The Liberals always picked up seats in the mid-term of unpopular governments, both Tory and Labour, and in their current guise as Liberal Democrats they still do - although since the current Labour government can scarcely be described as unpopular, they have not taken one in such circumstances this term. In 1987 Elizabeth Shields seized the huge rural North Yorkshire seat of Ryedale, overturning a 16,000 Tory majority. However, a really solid Conservative seat can usually be identified when it is immediately recovered and never relapses into its liberal heresy. This is the case here, and John Greenway has always proved himself electable in Ryedale.

John Greenway, a Conservative sport and tourism spokesman, is a former policeman-turned-insurance broker, elected in 1987. Mildly astigmatic, and cold-eyed in a way not untypical of officers of the watch, and regarded as a somewhat discursive and moderately cerebral speaker, he voices the policeman's desire to hang police murderers, especially Winston Silcot. Born 1946 and educated at Sir John Deane's Grammar School, Northwich and Hendon Police College, although interestingly a backer of Kenneth Clarke for leader in 1997, as a Yorkshire neighbour of William Hague he was brought onto the front bench as a Home Affairs spokesman.
 |
| Wealthy Achievers, Suburban Areas |
7.48% |
14.99% |
49.89 |
|
| Affluent Greys, Rural Communities |
21.61% |
2.13% |
1,016.55 |
|
| Prosperous Pensioners, Retirement Areas |
6.40% |
2.49% |
257.58 |
|
| Affluent Executives, Family Areas |
0.70% |
4.43% |
15.90 |
|
| Well-Off Workers, Family Areas |
6.23% |
7.27% |
85.69 |
|
| Affluent Urbanites, Town & City Areas |
0.00% |
2.56% |
0.00 |
|
| Prosperous Professionals, Metropolitan Areas |
0.00% |
2.04% |
0.00 |
|
| Better-Off Executives, Inner City Areas |
0.10% |
3.94% |
2.54 |
|
| Comfortable Middle Agers, Mature Home Owning Areas |
26.66% |
13.04% |
204.45 |
|
| Skilled Workers, Home Owning Areas |
9.53% |
12.70% |
75.00 |
|
| New Home Owners, Mature Communities |
11.60% |
8.14% |
142.42 |
|
| White Collar Workers, Better-Off Multi Ethnic Areas |
4.01% |
4.02% |
99.68 |
|
| Older People, Less Prosperous Areas |
2.43% |
3.19% |
76.33 |
|
| Council Estate Residents, Better-Off Homes |
2.65% |
11.31% |
23.42 |
|
| Council Estate Residents, High Unemployment |
0.22% |
3.06% |
7.33 |
|
| Council Estate Residents, Greatest Hardship |
0.00% |
2.52% |
0.00 |
|
| People in Multi-Ethnic, Low-Income Areas |
0.00% |
2.10% |
0.00 |
|
| Unclassified |
0.37% |
0.06% |
590.38 |
|
|
 |
 |
 |
| £0-5K |
8.81% |
9.41% |
93.58 |
|
| £5-10K |
17.96% |
16.63% |
107.96 |
|
| £10-15K |
18.73% |
16.58% |
112.97 |
|
| £15-20K |
15.25% |
13.58% |
112.25 |
|
| £20-25K |
11.25% |
10.39% |
108.25 |
|
| £25-30K |
7.98% |
7.77% |
102.68 |
|
| £30-35K |
5.59% |
5.79% |
96.54 |
|
| £35-40K |
3.92% |
4.33% |
90.39 |
|
| £40-45K |
2.76% |
3.27% |
84.52 |
|
| £45-50K |
1.96% |
2.48% |
79.05 |
|
| £50-55K |
1.41% |
1.90% |
74.02 |
|
| £55-60K |
1.02% |
1.47% |
69.44 |
|
| £60-65K |
0.75% |
1.15% |
65.27 |
|
| £65-70K |
0.56% |
0.91% |
61.50 |
|
| £70-75K |
0.42% |
0.72% |
58.07 |
|
| £75-80K |
0.32% |
0.57% |
54.97 |
|
| £80-85K |
0.24% |
0.46% |
52.15 |
|
| £85-90K |
0.19% |
0.37% |
49.58 |
|
| £90-95K |
0.14% |
0.31% |
47.25 |
|
| £95-100K |
0.11% |
0.25% |
45.11 |
|
| £100K + |
0.48% |
1.34% |
35.68 |
|
|
|

|


|
1992-1997
|
1997-2001
|
|
|
|
| Con |
-11.63% |
| Lab |
3.36% |
| LD |
3.40% |
|
| Con |
3.41% |
| Lab |
-3.22% |
| LD |
2.67% |
|
|
 |
John Greenway
Conservative hold
|
| Con |
 |
20,711 |
47.18% |
| Lab |
 |
6,470 |
14.74% |
| LD |
 |
15,836 |
36.07% |
| Oth |
 |
882 |
2.01% |
| Maj |
 |
4,875 |
11.11% |
| Turn |
 |
43,899 |
65.97% |
|
|
 |
John Greenway
Conservative hold
|
| L |
David Ellis |
6,470 |
14.74% |
| UK |
Stephen Feaster |
882 |
2.01% |
| C |
John Greenway |
20,711 |
47.18% |
| LD |
Keith Orrell |
15,836 |
36.07% |
|
Candidates representing 4 parties stood for election to this seat.
|
|
 |
John Greenway
Conservative
|
| Con |
 |
21,351 |
43.77% |
| Lab |
 |
8,762 |
17.96% |
| LD |
 |
16,293 |
33.40% |
| Ref |
 |
1,460 |
2.99% |
| Oth |
 |
917 |
1.88% |
| Maj |
 |
5,058 |
10.37% |
| Turn |
 |
48,783 |
74.80% |
|
|
 |
|
Conservative
|
| Con |
 |
28,338 |
55.40% |
| Lab |
 |
7,497 |
14.60% |
| LD |
 |
15,340 |
30.00% |
| Oth |
|
0 |
0.00% |
| Maj |
 |
12,998 |
25.40% |
| Turn |
 |
51,175 |
81.00% |
|
|
 |
|

|

