|
St Albans
Labour hold

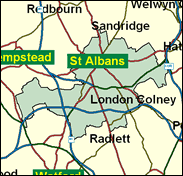
With its Roman heritage as Verulamium, and its medieval cathedral, St Albans looks the part of a historic Tory stronghold. Yet another of Labour's surprise gains in 1997, Kerry Pollard must be very careful and energetic in defending his 4,459 majority. It may well be very close. The Conservatives were 10pc ahead in the Euro elections of 1999, their best set of results in recent years, but the local election figures from 2000 were almost dead even. Seeing as these were also a better than average set of May figures than in other years during this Parliament, Pollard may even be slight favourite to hold on here, in by far the oldest urban unit in the modern county of Hertfordshire, with an end of term turnout and verdict.

Kerry Pollard, elected in 1997 as only the second-ever Labour MP for St Albans - the 1945 landslide having produced the first - is rare among the big 1997 intake as a fairly regular backbench rebel, on student grant abolition, criminal justice, Nato bombing of Kosovo, disability benefit cuts, and pensions link to earnings. A Catholic, trim-bearded, former local councillor, he was born in 1944, educated at Thornleigh Grammar School and Thornleigh College, Bolton, and worked for over 30 years as an engineer with British Gas. The 28th least-expected Labour MP in 1997 and calling in March this year for rail nationalisation, he is now confronting his potential nemesis in the shape of Conservative, Charles Elphicke. A tax barrister, born 1971 and educated at Felstead School and Nottingham University, he was reared on an Essex farm, served 4 years on Lambeth Council, and has served as an adviser to Francis Maude, as Shadow Chancellor.
 |
| Wealthy Achievers, Suburban Areas |
32.16% |
14.99% |
214.47 |
|
| Affluent Greys, Rural Communities |
0.00% |
2.13% |
0.00 |
|
| Prosperous Pensioners, Retirement Areas |
1.36% |
2.49% |
54.87 |
|
| Affluent Executives, Family Areas |
4.20% |
4.43% |
94.88 |
|
| Well-Off Workers, Family Areas |
6.75% |
7.27% |
92.83 |
|
| Affluent Urbanites, Town & City Areas |
10.28% |
2.56% |
400.77 |
|
| Prosperous Professionals, Metropolitan Areas |
8.21% |
2.04% |
402.22 |
|
| Better-Off Executives, Inner City Areas |
1.33% |
3.94% |
33.65 |
|
| Comfortable Middle Agers, Mature Home Owning Areas |
14.52% |
13.04% |
111.39 |
|
| Skilled Workers, Home Owning Areas |
3.92% |
12.70% |
30.88 |
|
| New Home Owners, Mature Communities |
6.72% |
8.14% |
82.48 |
|
| White Collar Workers, Better-Off Multi Ethnic Areas |
4.94% |
4.02% |
122.89 |
|
| Older People, Less Prosperous Areas |
0.95% |
3.19% |
29.81 |
|
| Council Estate Residents, Better-Off Homes |
3.39% |
11.31% |
29.97 |
|
| Council Estate Residents, High Unemployment |
0.48% |
3.06% |
15.66 |
|
| Council Estate Residents, Greatest Hardship |
0.00% |
2.52% |
0.00 |
|
| People in Multi-Ethnic, Low-Income Areas |
0.72% |
2.10% |
34.31 |
|
| Unclassified |
0.07% |
0.06% |
107.93 |
|
|
 |
 |
 |
| £0-5K |
4.69% |
9.41% |
49.85 |
|
| £5-10K |
9.53% |
16.63% |
57.31 |
|
| £10-15K |
11.60% |
16.58% |
69.97 |
|
| £15-20K |
11.46% |
13.58% |
84.38 |
|
| £20-25K |
10.32% |
10.39% |
99.29 |
|
| £25-30K |
8.87% |
7.77% |
114.10 |
|
| £30-35K |
7.44% |
5.79% |
128.45 |
|
| £35-40K |
6.16% |
4.33% |
142.17 |
|
| £40-45K |
5.07% |
3.27% |
155.17 |
|
| £45-50K |
4.16% |
2.48% |
167.42 |
|
| £50-55K |
3.41% |
1.90% |
178.93 |
|
| £55-60K |
2.80% |
1.47% |
189.73 |
|
| £60-65K |
2.30% |
1.15% |
199.85 |
|
| £65-70K |
1.90% |
0.91% |
209.34 |
|
| £70-75K |
1.57% |
0.72% |
218.24 |
|
| £75-80K |
1.30% |
0.57% |
226.61 |
|
| £80-85K |
1.08% |
0.46% |
234.46 |
|
| £85-90K |
0.91% |
0.37% |
241.86 |
|
| £90-95K |
0.76% |
0.31% |
248.83 |
|
| £95-100K |
0.64% |
0.25% |
255.41 |
|
| £100K + |
3.90% |
1.34% |
289.85 |
|
|
|

|


|
1992-1997
|
1997-2001
|
|
|
|
| Con |
-12.48% |
| Lab |
17.00% |
| LD |
-6.95% |
|
| Con |
2.02% |
| Lab |
3.45% |
| LD |
-3.11% |
|
|
 |
Kerry Pollard
Labour hold
|
| Con |
 |
15,423 |
35.24% |
| Lab |
 |
19,889 |
45.45% |
| LD |
 |
7,847 |
17.93% |
| Oth |
 |
602 |
1.38% |
| Maj |
 |
4,466 |
10.21% |
| Turn |
 |
43,761 |
66.26% |
|
|
 |
Kerry Pollard
Labour hold
|
| C |
Charles Elphicke |
15,423 |
35.24% |
| L |
Kerry Pollard |
19,889 |
45.45% |
| LD |
Nick Rijke |
7,847 |
17.93% |
| UK |
Christopher Sherwin |
602 |
1.38% |
|
Candidates representing 4 parties stood for election to this seat.
|
|
 |
Kerry Pollard
Labour gain
|
| Con |
 |
16,879 |
33.22% |
| Lab |
 |
21,338 |
42.00% |
| LD |
 |
10,692 |
21.05% |
| Ref |
 |
1,619 |
3.19% |
| Oth |
 |
277 |
0.55% |
| Maj |
 |
4,459 |
8.78% |
| Turn |
 |
50,805 |
77.49% |
|
|
 |
|
Conservative
|
| Con |
 |
23,586 |
45.70% |
| Lab |
 |
12,932 |
25.00% |
| LD |
 |
14,452 |
28.00% |
| Oth |
 |
690 |
1.30% |
| Maj |
 |
9,134 |
17.70% |
| Turn |
 |
51,660 |
79.76% |
|
|
 |
|

|

