|
St Helens North
Labour hold

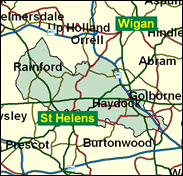
St Helens North contains only the northern edge of the town itself, the wards around the A580 East Lancs Road. Most of its population is in previously independent communities, sucked into the Borough of St Helens and into Merseyside in the local government reforms of the early 1970s, such as Billinge, Haydock (the site of Haydock Park racecourse, the track in Merseyside on which the Grand National is not run), Rainford and Newton-le-Willows. This is slightly the more affluent and less working class of the two St Helens seats, with desirable residential areas in the two usually Tory wards of Windle (north west St Helens) and Rainford (not to be confused with Rainhill, which is not far away). It is also very slightly the less overwhelmingly Labour, but that scarcely matters.

Dave Watts, PPS to John Spellar, is a low-flying 1997 entrant off the local council, which he led for four years, still locally-focused on regional-necessary EU grants and resentful of the rate support disparity between (Tory) Westminster Council and St Helens. Born 1951 and educated at a secondary modern in Huyton, he worked for his predecessor John Evans MP and before that was a shop steward at a United Biscuits factory. He backs first-past-the-post voting and the Greeks in Cyprus.
 |
| Wealthy Achievers, Suburban Areas |
7.61% |
14.99% |
50.78 |
|
| Affluent Greys, Rural Communities |
0.00% |
2.13% |
0.00 |
|
| Prosperous Pensioners, Retirement Areas |
0.24% |
2.49% |
9.80 |
|
| Affluent Executives, Family Areas |
1.48% |
4.43% |
33.52 |
|
| Well-Off Workers, Family Areas |
23.30% |
7.27% |
320.38 |
|
| Affluent Urbanites, Town & City Areas |
0.00% |
2.56% |
0.00 |
|
| Prosperous Professionals, Metropolitan Areas |
0.00% |
2.04% |
0.00 |
|
| Better-Off Executives, Inner City Areas |
0.00% |
3.94% |
0.00 |
|
| Comfortable Middle Agers, Mature Home Owning Areas |
10.75% |
13.04% |
82.41 |
|
| Skilled Workers, Home Owning Areas |
19.98% |
12.70% |
157.32 |
|
| New Home Owners, Mature Communities |
14.43% |
8.14% |
177.20 |
|
| White Collar Workers, Better-Off Multi Ethnic Areas |
0.11% |
4.02% |
2.77 |
|
| Older People, Less Prosperous Areas |
4.01% |
3.19% |
125.83 |
|
| Council Estate Residents, Better-Off Homes |
15.56% |
11.31% |
137.58 |
|
| Council Estate Residents, High Unemployment |
0.51% |
3.06% |
16.74 |
|
| Council Estate Residents, Greatest Hardship |
2.00% |
2.52% |
79.55 |
|
| People in Multi-Ethnic, Low-Income Areas |
0.00% |
2.10% |
0.00 |
|
| Unclassified |
0.00% |
0.06% |
0.00 |
|
|
 |
 |
 |
| £0-5K |
10.49% |
9.41% |
111.45 |
|
| £5-10K |
17.95% |
16.63% |
107.92 |
|
| £10-15K |
17.48% |
16.58% |
105.44 |
|
| £15-20K |
14.07% |
13.58% |
103.55 |
|
| £20-25K |
10.56% |
10.39% |
101.57 |
|
| £25-30K |
7.72% |
7.77% |
99.25 |
|
| £30-35K |
5.59% |
5.79% |
96.58 |
|
| £35-40K |
4.06% |
4.33% |
93.65 |
|
| £40-45K |
2.96% |
3.27% |
90.58 |
|
| £45-50K |
2.17% |
2.48% |
87.45 |
|
| £50-55K |
1.61% |
1.90% |
84.34 |
|
| £55-60K |
1.20% |
1.47% |
81.30 |
|
| £60-65K |
0.90% |
1.15% |
78.37 |
|
| £65-70K |
0.68% |
0.91% |
75.57 |
|
| £70-75K |
0.52% |
0.72% |
72.90 |
|
| £75-80K |
0.40% |
0.57% |
70.38 |
|
| £80-85K |
0.31% |
0.46% |
68.00 |
|
| £85-90K |
0.25% |
0.37% |
65.77 |
|
| £90-95K |
0.19% |
0.31% |
63.66 |
|
| £95-100K |
0.15% |
0.25% |
61.68 |
|
| £100K + |
0.70% |
1.34% |
51.98 |
|
|
|

|


|
1992-1997
|
1997-2001
|
|
|
|
| Con |
-11.16% |
| Lab |
7.01% |
| LD |
-0.36% |
|
| Con |
1.48% |
| Lab |
-3.80% |
| LD |
4.84% |
|
|
 |
Dave Watts
Labour hold
|
| Con |
 |
7,076 |
18.82% |
| Lab |
 |
22,977 |
61.11% |
| LD |
 |
6,609 |
17.58% |
| Oth |
 |
939 |
2.50% |
| Maj |
 |
15,901 |
42.29% |
| Turn |
 |
37,601 |
53.30% |
|
|
 |
Dave Watts
Labour hold
|
| LD |
John Beirne |
6,609 |
17.58% |
| C |
Simon Pearce |
7,076 |
18.82% |
| L |
Dave Watts |
22,977 |
61.11% |
| SL |
Stephen Whatam |
939 |
2.50% |
|
Candidates representing 4 parties stood for election to this seat.
|
|
 |
Dave Watts
Labour
|
| Con |
 |
8,536 |
17.34% |
| Lab |
 |
31,953 |
64.91% |
| LD |
 |
6,270 |
12.74% |
| Ref |
 |
1,276 |
2.59% |
| Oth |
 |
1,195 |
2.43% |
| Maj |
 |
23,417 |
47.57% |
| Turn |
 |
49,230 |
68.97% |
|
|
 |
|
Labour
|
| Con |
 |
15,686 |
28.50% |
| Lab |
 |
31,930 |
57.90% |
| LD |
 |
7,224 |
13.10% |
| Oth |
 |
287 |
0.50% |
| Maj |
 |
16,244 |
29.50% |
| Turn |
 |
55,127 |
76.68% |
|
|
 |
|

|

