|
Aberdeenshire West & Kincardine
Liberal Democrat hold

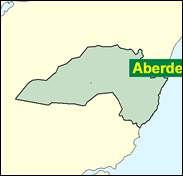
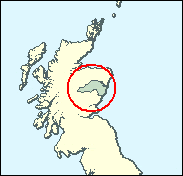
This seat stretches from Royal Deeside around Braemar and Ballater in the west, through the prosperous little communities such as Banchory and Aboyne in Mid Deeside, to the former coastal county of Kincardine, which includes the port of Stonehaven, the new developments of Portleven and the farmland of the Mearns. The predominant tradition is Conservative, with Liberal incursions in bad times for the Tories, such as the 1966 general election in Aberdeenshire West and the 1991 by-election in Kincardine and Deeside, and then in 1997 in this redrawn and united seat. The Conservative challenge in this marginal area provides a headache for first-term Liberal Democrat MP Sir Robert Smith, as they were only six per cent behind in the Scottish Parliament elections in 1999, which was also neither the best of times or circumstances for the predominantly anti-devolution Scottish Tories. This is probably the most vulnerable Lib Dem seat north of the border.

Big, affable, diffident Sir Robert Smith, born 1958, educated at Merchant Taylors, Northwood, and Aberdeen University, a local farmer and baronet, is a Lib Dem MP with usefully dispersed political antecedants. He is a former leading local figure in the SDP, but his grandfather, the first baronet, was the local Conservative MP between the Wars, and the late Alick Buchanan-Smith, Tory MP for Kincardine until 1991 was a distant cousin. These Conservative roots mingle well with his own cautious votes on gun control and hunting while his urban colleagues vote the more politically correct ticket. He reflects the fact that in Scotland the Liberal Democrats partly double-up as an acceptable version of the Tory party. The actual Conservative challenger here will by Tom Kerr, born 1947, educated at Linlithgow Academy, currently a self-employed marine surveyor and consultant, formerly a BP marine engineer, and a West Lothian District councillor from 1992.

 |
| Wealthy Achievers, Suburban Areas |
18.83% |
14.99% |
125.61 |
|
| Affluent Greys, Rural Communities |
11.21% |
2.13% |
527.25 |
|
| Prosperous Pensioners, Retirement Areas |
1.33% |
2.49% |
53.47 |
|
| Affluent Executives, Family Areas |
14.40% |
4.43% |
325.39 |
|
| Well-Off Workers, Family Areas |
16.22% |
7.27% |
223.05 |
|
| Affluent Urbanites, Town & City Areas |
1.56% |
2.56% |
61.00 |
|
| Prosperous Professionals, Metropolitan Areas |
0.23% |
2.04% |
11.33 |
|
| Better-Off Executives, Inner City Areas |
0.82% |
3.94% |
20.87 |
|
| Comfortable Middle Agers, Mature Home Owning Areas |
9.69% |
13.04% |
74.35 |
|
| Skilled Workers, Home Owning Areas |
2.60% |
12.70% |
20.47 |
|
| New Home Owners, Mature Communities |
8.33% |
8.14% |
102.29 |
|
| White Collar Workers, Better-Off Multi Ethnic Areas |
1.12% |
4.02% |
27.73 |
|
| Older People, Less Prosperous Areas |
2.05% |
3.19% |
64.43 |
|
| Council Estate Residents, Better-Off Homes |
9.54% |
11.31% |
84.32 |
|
| Council Estate Residents, High Unemployment |
1.51% |
3.06% |
49.38 |
|
| Council Estate Residents, Greatest Hardship |
0.41% |
2.52% |
16.29 |
|
| People in Multi-Ethnic, Low-Income Areas |
0.00% |
2.10% |
0.00 |
|
| Unclassified |
0.13% |
0.06% |
214.80 |
|
|
 |
|
|
| £0-5K |
5.30% |
9.41% |
56.30 |
|
| £5-10K |
11.05% |
16.63% |
66.45 |
|
| £10-15K |
13.26% |
16.58% |
79.98 |
|
| £15-20K |
12.73% |
13.58% |
93.71 |
|
| £20-25K |
11.07% |
10.39% |
106.47 |
|
| £25-30K |
9.16% |
7.77% |
117.83 |
|
| £30-35K |
7.40% |
5.79% |
127.69 |
|
| £35-40K |
5.90% |
4.33% |
136.12 |
|
| £40-45K |
4.68% |
3.27% |
143.27 |
|
| £45-50K |
3.71% |
2.48% |
149.28 |
|
| £50-55K |
2.94% |
1.90% |
154.32 |
|
| £55-60K |
2.34% |
1.47% |
158.52 |
|
| £60-65K |
1.87% |
1.15% |
162.02 |
|
| £65-70K |
1.49% |
0.91% |
164.90 |
|
| £70-75K |
1.20% |
0.72% |
167.26 |
|
| £75-80K |
0.97% |
0.57% |
169.19 |
|
| £80-85K |
0.79% |
0.46% |
170.73 |
|
| £85-90K |
0.64% |
0.37% |
171.96 |
|
| £90-95K |
0.53% |
0.31% |
172.90 |
|
| £95-100K |
0.43% |
0.25% |
173.60 |
|
| £100K + |
2.31% |
1.34% |
172.19 |
|
|
|
|


|
1992-1997
|
1997-2001
|
|
|
|
| Con |
-10.18% |
| Lab |
2.28% |
| LD |
6.38% |
| SNP |
0.56% |
|
| Con |
0.64% |
| Lab |
5.12% |
| LD |
9.15% |
| SNP |
-13.06% |
|
|
|
Robert Smith
Liberal Democrat hold
|
| Con |
 |
11,686 |
35.56% |
| Lab |
 |
4,669 |
14.21% |
| LD |
 |
16,507 |
50.23% |
| Oth |
|
0 |
0.00% |
| Maj |
 |
4,821 |
14.67% |
| Turn |
|
32,862 |
53.71% |
|
|
|
Robert Smith
Liberal Democrat hold
|
| L |
Kevin Hutchens |
4,669 |
14.21% |
| C |
Tom Kerr |
11,686 |
35.56% |
| LD |
Robert Smith |
16,507 |
50.23% |
|
Candidates representing 3 parties stood for election to this seat.
|
|
|
Robert Smith
Liberal Democrat gain
|
| Con |
|
15,080 |
34.92% |
| Lab |
|
3,923 |
9.08% |
| LD |
|
17,742 |
41.08% |
| SNP |
 |
5,639 |
13.06% |
| Ref |
 |
805 |
1.86% |
| Oth |
|
0 |
0.00% |
| Maj |
|
2,662 |
6.16% |
| Turn |
|
43,189 |
73.05% |
|
|
|
|
Conservative
|
| Con |
|
19,123 |
45.10% |
| Lab |
|
2,886 |
6.80% |
| LD |
|
14,686 |
34.70% |
| SNP |
|
5,280 |
12.50% |
| Oth |
 |
381 |
0.90% |
| Maj |
|
4,437 |
10.50% |
| Turn |
|
42,356 |
76.88% |
|
|
|
|
|