|
Bexleyheath & Crayford
Labour hold

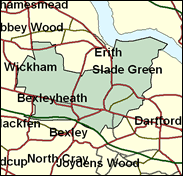
Watch out for a likely switch to the Conservatives in this new seat in Bexley Borough, outer south east London, which amazed most observers - and many of its electors - by returning Labour's Nigel Beard in its first contest in 1997. Housing is 80pc owner-occupied, and more than 60pc work in non-manual jobs. This should add up to a Tory banker in a part of Kentish London with little in the way of a Labour tradition. Even by the May 1998 London Borough elections, the Conservatives had closed the gap in the wards that make up this seat to just one per cent, and by the euro-elections in June 1999 they were 10pc up on a slightly higher than average turnout. David Evennett is one of around a dozen former Tory MPs seeking election for the constituencies they held before the 1997 cataclysm.

Labour's Nigel Beard won this seat from the Conservatives in 1997. An industrial manager who has specialised in science and technology, he was the oldest Labour entrant in 1997, backs greater industrial democracy, government support for high-tech industries, EU control of the arms trade and electoral reform. He now defends the seat aged 64, opposed by the man he beat, David Evennett, an Essex-born rightwinger, educated at Buckhurst Hill High School and the LSE and a loss-making Lloyds marine broker, who was the area's MP from 1983 to 1997, served as PPS to John Redwood and Gillian Shephard and called for BBC privatisation in 1994.
 |
| Wealthy Achievers, Suburban Areas |
5.02% |
14.99% |
33.47 |
|
| Affluent Greys, Rural Communities |
0.00% |
2.13% |
0.00 |
|
| Prosperous Pensioners, Retirement Areas |
1.44% |
2.49% |
57.91 |
|
| Affluent Executives, Family Areas |
0.12% |
4.43% |
2.67 |
|
| Well-Off Workers, Family Areas |
7.64% |
7.27% |
104.99 |
|
| Affluent Urbanites, Town & City Areas |
3.46% |
2.56% |
134.80 |
|
| Prosperous Professionals, Metropolitan Areas |
0.22% |
2.04% |
10.97 |
|
| Better-Off Executives, Inner City Areas |
0.00% |
3.94% |
0.00 |
|
| Comfortable Middle Agers, Mature Home Owning Areas |
50.07% |
13.04% |
383.98 |
|
| Skilled Workers, Home Owning Areas |
13.78% |
12.70% |
108.50 |
|
| New Home Owners, Mature Communities |
8.86% |
8.14% |
108.75 |
|
| White Collar Workers, Better-Off Multi Ethnic Areas |
0.00% |
4.02% |
0.00 |
|
| Older People, Less Prosperous Areas |
3.17% |
3.19% |
99.65 |
|
| Council Estate Residents, Better-Off Homes |
5.24% |
11.31% |
46.37 |
|
| Council Estate Residents, High Unemployment |
0.98% |
3.06% |
32.12 |
|
| Council Estate Residents, Greatest Hardship |
0.00% |
2.52% |
0.00 |
|
| People in Multi-Ethnic, Low-Income Areas |
0.00% |
2.10% |
0.00 |
|
| Unclassified |
0.00% |
0.06% |
0.00 |
|
|
 |
 |
 |
| £0-5K |
6.80% |
9.41% |
72.20 |
|
| £5-10K |
13.27% |
16.63% |
79.77 |
|
| £10-15K |
14.88% |
16.58% |
89.77 |
|
| £15-20K |
13.46% |
13.58% |
99.07 |
|
| £20-25K |
11.12% |
10.39% |
106.95 |
|
| £25-30K |
8.81% |
7.77% |
113.35 |
|
| £30-35K |
6.86% |
5.79% |
118.42 |
|
| £35-40K |
5.30% |
4.33% |
122.35 |
|
| £40-45K |
4.09% |
3.27% |
125.34 |
|
| £45-50K |
3.17% |
2.48% |
127.55 |
|
| £50-55K |
2.46% |
1.90% |
129.15 |
|
| £55-60K |
1.92% |
1.47% |
130.23 |
|
| £60-65K |
1.51% |
1.15% |
130.92 |
|
| £65-70K |
1.19% |
0.91% |
131.27 |
|
| £70-75K |
0.94% |
0.72% |
131.37 |
|
| £75-80K |
0.75% |
0.57% |
131.25 |
|
| £80-85K |
0.61% |
0.46% |
130.97 |
|
| £85-90K |
0.49% |
0.37% |
130.55 |
|
| £90-95K |
0.40% |
0.31% |
130.02 |
|
| £95-100K |
0.32% |
0.25% |
129.40 |
|
| £100K + |
1.66% |
1.34% |
123.36 |
|
|
|

|


|
1992-1997
|
1997-2001
|
|
|
|
| Con |
-15.78% |
| Lab |
14.20% |
| LD |
-3.12% |
|
| Con |
1.51% |
| Lab |
-1.93% |
| LD |
-0.09% |
|
|
 |
Nigel Beard
Labour hold
|
| Con |
 |
16,121 |
39.93% |
| Lab |
 |
17,593 |
43.57% |
| LD |
 |
4,476 |
11.09% |
| Oth |
 |
2,188 |
5.42% |
| Maj |
 |
1,472 |
3.65% |
| Turn |
 |
40,378 |
63.51% |
|
|
 |
Nigel Beard
Labour hold
|
| L |
Nigel Beard |
17,593 |
43.57% |
| UK |
John Dunford |
780 |
1.93% |
| C |
David Evennett |
16,121 |
39.93% |
| LD |
Nickolas O'Hare |
4,476 |
11.09% |
| BNP |
Colin Smith |
1,408 |
3.49% |
|
Candidates representing 5 parties stood for election to this seat.
|
|
 |
Nigel Beard
Labour gain
|
| Con |
 |
18,527 |
38.42% |
| Lab |
 |
21,942 |
45.50% |
| LD |
 |
5,391 |
11.18% |
| Ref |
 |
1,551 |
3.22% |
| Oth |
 |
812 |
1.68% |
| Maj |
 |
3,415 |
7.08% |
| Turn |
 |
48,223 |
76.14% |
|
|
 |
|
Conservative
|
| Con |
 |
28,380 |
54.20% |
| Lab |
 |
16,377 |
31.30% |
| LD |
 |
7,515 |
14.30% |
| Oth |
 |
115 |
0.20% |
| Maj |
 |
12,003 |
22.90% |
| Turn |
 |
52,387 |
81.09% |
|
|
 |
|

|

