|
St Helens South
Labour hold

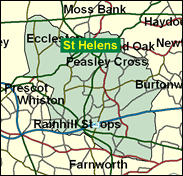
St Helens is a tough working class town. It is overshadowed by the factories of Pilkington's, one of the world's leading glass makers, and its ancillary industries, and the area around Parr used to host coal mining too. As in the case of its rival Wigan, the most popular and successful sport in St Helens is Rugby League, that epitome of masculine, northern, muscular, working-class culture; St Helens is one of the largest towns not to have Football League soccer club. The metropolitan borough of St Helens has covered a wider area since 1974, but most of the area within the more historic community boundaries lies in this South division. It is a town of fixed and traditional tastes, and one of these is the Labour party, even in its modernised and sanitised incarnation. Whether this stretches as far as Shaun Woodward, who is more of a reincarnation as a converted (if leadership-coverted) Tory MP, remains to be seen. A choice for more Left-wing, or perhaps more traditional , voters will be offered by the candidature of Neil Thompson, a miner’s son and last-minute defector from Labour to the Socialist Alliance. One final oddity: Shaun Woodward said he left the Conservative Party because of the Tories' social illiberalism, specifically their refusal to back the repeal of Section 28 on the promoton of homosexuality. Yet Gerald Bermingham was one of a handful of Labour MPs to oppose any reduction at all in the gay age of consent, a sentiment which may well have suited a constituency with a high proportion of Roman Catholic and working class voters.

Shaun Woodward, the floor-crossing Conservative who switched to Labour over Tory homophobia and europhobia in December 1999, was deftly dropped in here by Millbank at the start of the election campaign courtesy of the last minute withdrawal of the sitting MP Gerry Bermingham. Born in 1958 and educated at Bristol Grammar School and Jesus College Cambridge, Woodward married a Sainsbury heiress and worked at Central Office and the BBC before being elected as Tory MP for Witney in 1997. With his sudden switching to Labour after two-and-a-half years as a partisan Labour-baiting MP seeming less convincing than the slower transition of fellow Tory deserters Alan Howarth and Peter Temple-Morris, the choice of St Helens for his new career as a Labour MP has a certain symmetry. For it was here between 1945 and 1958 that the Labour MP was Sir Hartley Shawcross, whose eventual desertion of Labour was to earn him the sobriquet “Sir Shortly Floorcross”.
 |
| Wealthy Achievers, Suburban Areas |
11.77% |
14.99% |
78.48 |
|
| Affluent Greys, Rural Communities |
0.00% |
2.13% |
0.00 |
|
| Prosperous Pensioners, Retirement Areas |
0.00% |
2.49% |
0.00 |
|
| Affluent Executives, Family Areas |
0.31% |
4.43% |
6.95 |
|
| Well-Off Workers, Family Areas |
15.20% |
7.27% |
208.96 |
|
| Affluent Urbanites, Town & City Areas |
0.00% |
2.56% |
0.00 |
|
| Prosperous Professionals, Metropolitan Areas |
0.00% |
2.04% |
0.00 |
|
| Better-Off Executives, Inner City Areas |
0.19% |
3.94% |
4.79 |
|
| Comfortable Middle Agers, Mature Home Owning Areas |
5.15% |
13.04% |
39.51 |
|
| Skilled Workers, Home Owning Areas |
30.08% |
12.70% |
236.83 |
|
| New Home Owners, Mature Communities |
7.96% |
8.14% |
97.69 |
|
| White Collar Workers, Better-Off Multi Ethnic Areas |
0.07% |
4.02% |
1.77 |
|
| Older People, Less Prosperous Areas |
4.15% |
3.19% |
130.28 |
|
| Council Estate Residents, Better-Off Homes |
17.49% |
11.31% |
154.67 |
|
| Council Estate Residents, High Unemployment |
1.62% |
3.06% |
52.77 |
|
| Council Estate Residents, Greatest Hardship |
5.95% |
2.52% |
236.44 |
|
| People in Multi-Ethnic, Low-Income Areas |
0.00% |
2.10% |
0.00 |
|
| Unclassified |
0.06% |
0.06% |
95.32 |
|
|
 |
 |
 |
| £0-5K |
12.16% |
9.41% |
129.12 |
|
| £5-10K |
19.53% |
16.63% |
117.40 |
|
| £10-15K |
18.14% |
16.58% |
109.41 |
|
| £15-20K |
13.99% |
13.58% |
103.00 |
|
| £20-25K |
10.11% |
10.39% |
97.27 |
|
| £25-30K |
7.15% |
7.77% |
91.94 |
|
| £30-35K |
5.04% |
5.79% |
86.93 |
|
| £35-40K |
3.56% |
4.33% |
82.25 |
|
| £40-45K |
2.54% |
3.27% |
77.93 |
|
| £45-50K |
1.84% |
2.48% |
73.98 |
|
| £50-55K |
1.34% |
1.90% |
70.37 |
|
| £55-60K |
0.99% |
1.47% |
67.10 |
|
| £60-65K |
0.74% |
1.15% |
64.14 |
|
| £65-70K |
0.56% |
0.91% |
61.47 |
|
| £70-75K |
0.42% |
0.72% |
59.06 |
|
| £75-80K |
0.33% |
0.57% |
56.87 |
|
| £80-85K |
0.25% |
0.46% |
54.90 |
|
| £85-90K |
0.20% |
0.37% |
53.10 |
|
| £90-95K |
0.16% |
0.31% |
51.48 |
|
| £95-100K |
0.12% |
0.25% |
49.99 |
|
| £100K + |
0.58% |
1.34% |
43.28 |
|
|
|

|


|
1992-1997
|
1997-2001
|
|
|
|
| Con |
-9.52% |
| Lab |
7.61% |
| LD |
-0.53% |
|
| Con |
-1.15% |
| Lab |
-18.92% |
| LD |
9.74% |
|
|
 |
Shaun Woodward
Labour hold
|
| Con |
 |
4,675 |
13.83% |
| Lab |
 |
16,799 |
49.70% |
| LD |
 |
7,814 |
23.12% |
| Oth |
 |
4,516 |
13.36% |
| Maj |
 |
8,985 |
26.58% |
| Turn |
 |
33,804 |
51.91% |
|
|
 |
Shaun Woodward
Labour hold
|
| Ind B |
David Braid |
80 |
0.24% |
| Ind M |
Michael Murphy |
271 |
0.80% |
| SL |
Mike Parry |
1,504 |
4.45% |
| C |
Lee Rotherham |
4,675 |
13.83% |
| UK |
Bryan Slater |
336 |
0.99% |
| LD |
Brian Spencer |
7,814 |
23.12% |
| SA |
Neil Thompson |
2,325 |
6.88% |
| L |
Shaun Woodward |
16,799 |
49.70% |
|
Candidates representing 8 parties stood for election to this seat.
|
|
 |
Gerry Bermingham
Labour
|
| Con |
 |
6,628 |
14.98% |
| Lab |
 |
30,367 |
68.61% |
| LD |
 |
5,919 |
13.37% |
| Ref |
 |
1,165 |
2.63% |
| Oth |
 |
179 |
0.40% |
| Maj |
 |
23,739 |
53.64% |
| Turn |
 |
44,258 |
66.53% |
|
|
 |
|
Labour
|
| Con |
 |
12,263 |
24.50% |
| Lab |
 |
30,572 |
61.00% |
| LD |
 |
6,961 |
13.90% |
| Oth |
 |
304 |
0.60% |
| Maj |
 |
18,309 |
36.50% |
| Turn |
 |
50,100 |
73.09% |
|
|
 |
|

|

