|
St Ives
Liberal Democrat hold

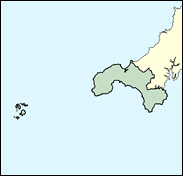
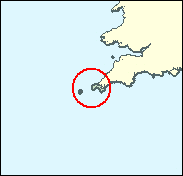
The very western tip of England, which also includes the Scilly Isles far off the coast, this Cornish seat looks safe for the Liberal Democrats who very nearly took it on other occasions before 1997. It is true that in the Euro-elections of June 1999, not only did the Conservatives finish 10pc ahead of the Lib Dems, but the UK Independence Party obtained no less than 15pc of the total vote in the St Ives section of the South West, well above average even for their best region; yet this was of course very much a one-issue election, and the low turnout (exactly 30pc here) suggests that enthusiasts (mainly enthusiastic Euro-sceptics, if there can be such creatures) took part. The Liberal Democrats' national pro-European policies do not however seem to hurt them in the west country - or are they toned down for local consumption? - and few would place any bets on the Tories to knock over George's 7,000 margin.

Andrew George, elected in 1997, is the first Liberal MP for St Ives since Walter Runciman defected to the National Liberals in 1932. Astigmatic, locally-born (1958) at Mullion and educated at Helston Grammar School, he attended University College Oxford, and is appropriately his party's fisheries spokesman, as MP for the fading, once-great fishing port of Newlyn. Representing a relatively urban seat he can afford votes against hunting bans, but otherwise operates as a critic of the Common Fisheries Policy and - a one-time member of Mebyon Kernow - a campaigner for all things Cornish.
 |
| Wealthy Achievers, Suburban Areas |
1.29% |
14.99% |
8.62 |
|
| Affluent Greys, Rural Communities |
30.56% |
2.13% |
1,437.04 |
|
| Prosperous Pensioners, Retirement Areas |
6.82% |
2.49% |
274.13 |
|
| Affluent Executives, Family Areas |
1.77% |
4.43% |
40.03 |
|
| Well-Off Workers, Family Areas |
3.15% |
7.27% |
43.25 |
|
| Affluent Urbanites, Town & City Areas |
0.00% |
2.56% |
0.00 |
|
| Prosperous Professionals, Metropolitan Areas |
0.00% |
2.04% |
0.00 |
|
| Better-Off Executives, Inner City Areas |
1.81% |
3.94% |
46.00 |
|
| Comfortable Middle Agers, Mature Home Owning Areas |
16.70% |
13.04% |
128.11 |
|
| Skilled Workers, Home Owning Areas |
10.23% |
12.70% |
80.50 |
|
| New Home Owners, Mature Communities |
8.71% |
8.14% |
107.01 |
|
| White Collar Workers, Better-Off Multi Ethnic Areas |
7.69% |
4.02% |
191.34 |
|
| Older People, Less Prosperous Areas |
4.84% |
3.19% |
151.98 |
|
| Council Estate Residents, Better-Off Homes |
5.07% |
11.31% |
44.80 |
|
| Council Estate Residents, High Unemployment |
0.67% |
3.06% |
21.75 |
|
| Council Estate Residents, Greatest Hardship |
0.69% |
2.52% |
27.53 |
|
| People in Multi-Ethnic, Low-Income Areas |
0.00% |
2.10% |
0.00 |
|
| Unclassified |
0.00% |
0.06% |
0.00 |
|
|
 |
 |
 |
| £0-5K |
12.82% |
9.41% |
136.19 |
|
| £5-10K |
22.50% |
16.63% |
135.30 |
|
| £10-15K |
20.24% |
16.58% |
122.07 |
|
| £15-20K |
14.51% |
13.58% |
106.80 |
|
| £20-25K |
9.66% |
10.39% |
92.98 |
|
| £25-30K |
6.32% |
7.77% |
81.29 |
|
| £30-35K |
4.15% |
5.79% |
71.58 |
|
| £35-40K |
2.75% |
4.33% |
63.51 |
|
| £40-45K |
1.85% |
3.27% |
56.77 |
|
| £45-50K |
1.27% |
2.48% |
51.10 |
|
| £50-55K |
0.88% |
1.90% |
46.30 |
|
| £55-60K |
0.62% |
1.47% |
42.20 |
|
| £60-65K |
0.45% |
1.15% |
38.68 |
|
| £65-70K |
0.32% |
0.91% |
35.63 |
|
| £70-75K |
0.24% |
0.72% |
32.98 |
|
| £75-80K |
0.18% |
0.57% |
30.65 |
|
| £80-85K |
0.13% |
0.46% |
28.61 |
|
| £85-90K |
0.10% |
0.37% |
26.80 |
|
| £90-95K |
0.08% |
0.31% |
25.19 |
|
| £95-100K |
0.06% |
0.25% |
23.75 |
|
| £100K + |
0.24% |
1.34% |
17.80 |
|
|
|

|


|
1992-1997
|
1997-2001
|
|
|
|
| Con |
-11.74% |
| Lab |
-0.82% |
| LD |
4.36% |
|
| Con |
0.02% |
| Lab |
-1.85% |
| LD |
7.12% |
|
|
 |
Andrew George
Liberal Democrat hold
|
| Con |
 |
15,360 |
31.18% |
| Lab |
 |
6,567 |
13.33% |
| LD |
 |
25,413 |
51.58% |
| Oth |
 |
1,926 |
3.91% |
| Maj |
 |
10,053 |
20.41% |
| Turn |
 |
49,266 |
66.35% |
|
|
 |
Andrew George
Liberal Democrat hold
|
| UK |
Mick Faulkner |
1,926 |
3.91% |
| LD |
Andrew George |
25,413 |
51.58% |
| L |
William Morris |
6,567 |
13.33% |
| C |
Joanna Richardson |
15,360 |
31.18% |
|
Candidates representing 4 parties stood for election to this seat.
|
|
 |
Andrew George
Liberal Democrat gain
|
| Con |
 |
16,796 |
31.16% |
| Lab |
 |
8,184 |
15.18% |
| LD |
 |
23,966 |
44.46% |
| Ref |
 |
3,714 |
6.89% |
| Oth |
 |
1,241 |
2.30% |
| Maj |
 |
7,170 |
13.30% |
| Turn |
 |
53,901 |
75.20% |
|
|
 |
|
Conservative
|
| Con |
 |
24,528 |
42.90% |
| Lab |
 |
9,144 |
16.00% |
| LD |
 |
22,883 |
40.10% |
| Oth |
 |
577 |
1.00% |
| Maj |
 |
1,645 |
2.90% |
| Turn |
 |
57,132 |
79.22% |
|
|
 |
|

|

