|
Salford
Labour hold

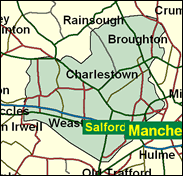
Coronation Street recently celebrated forty years of chronicling a popular view of working class culture, and make no bones about it, Weatherfield may be fictional, but it is in fact Salford. This is where Granada TV's studios are, with the "Corrie" set that is a popular pilgrimage destination for devotees or the merely curious. But if the nation's favourite soap opera over the years goes on and on, many of the residents of the real Salford do not. The population here has declined from 200,000 to 80,000 since the inter-war period due to slum clearance, and then often the clearance of the new post-wars slums put up in their place. As a result, Salford has been reduced to one seat only, and that with an electorate a dozen thousand less than the national average: after the next set of boundary changes Salford will have to pick up wards from other communities for the first time. Some trees do grow in Salford, on Broughton Park (Kersal ward) next to the affluent Prestwich in the Bury Borough, but more typical are Ordsall, Langworthy, Pendleton and Blackfriars (where the turnout was 13pc in May 2000's local elections). In these wards there are problems which would be too grim to be dramatised on the Street, at least while it occupies a peak hour, often reflecting a dysfunctional lack of community spirit, even while most residents bravely battle on.

Hazel Blears, elected here in 1997, a small, impish-looking solicitor previously employed with Manchester City Council, came with a leftwing reputation as a unilateralist and opponent of the Clause Four redraft, but has performed as a loyalist bowler of stooge questions and, for a while, Alan Millburn's PPS. Born 1956 and educated at Wardley Grammar School, Eccles Sixth Form College, Trent Polytechnic and Chester College of Law, and a Salford City Councillor for eight years, one of her helpful questions in February (2001) implicated former Tory MP Timothy Kirkhope with the Hinduja brothers, in order to take the heat off Mandelson and Vaz.
 |
| Wealthy Achievers, Suburban Areas |
2.99% |
14.99% |
19.95 |
|
| Affluent Greys, Rural Communities |
0.00% |
2.13% |
0.00 |
|
| Prosperous Pensioners, Retirement Areas |
2.19% |
2.49% |
87.90 |
|
| Affluent Executives, Family Areas |
0.00% |
4.43% |
0.00 |
|
| Well-Off Workers, Family Areas |
2.60% |
7.27% |
35.81 |
|
| Affluent Urbanites, Town & City Areas |
3.84% |
2.56% |
149.55 |
|
| Prosperous Professionals, Metropolitan Areas |
0.15% |
2.04% |
7.19 |
|
| Better-Off Executives, Inner City Areas |
5.79% |
3.94% |
146.78 |
|
| Comfortable Middle Agers, Mature Home Owning Areas |
8.84% |
13.04% |
67.82 |
|
| Skilled Workers, Home Owning Areas |
18.53% |
12.70% |
145.87 |
|
| New Home Owners, Mature Communities |
2.43% |
8.14% |
29.88 |
|
| White Collar Workers, Better-Off Multi Ethnic Areas |
2.53% |
4.02% |
63.00 |
|
| Older People, Less Prosperous Areas |
3.36% |
3.19% |
105.40 |
|
| Council Estate Residents, Better-Off Homes |
22.07% |
11.31% |
195.08 |
|
| Council Estate Residents, High Unemployment |
14.06% |
3.06% |
459.10 |
|
| Council Estate Residents, Greatest Hardship |
8.25% |
2.52% |
327.72 |
|
| People in Multi-Ethnic, Low-Income Areas |
2.37% |
2.10% |
113.09 |
|
| Unclassified |
0.00% |
0.06% |
0.00 |
|
|
 |
|
|
| £0-5K |
15.41% |
9.41% |
163.70 |
|
| £5-10K |
22.99% |
16.63% |
138.24 |
|
| £10-15K |
19.02% |
16.58% |
114.71 |
|
| £15-20K |
13.22% |
13.58% |
97.35 |
|
| £20-25K |
8.81% |
10.39% |
84.73 |
|
| £25-30K |
5.86% |
7.77% |
75.40 |
|
| £30-35K |
3.96% |
5.79% |
68.35 |
|
| £35-40K |
2.73% |
4.33% |
62.91 |
|
| £40-45K |
1.91% |
3.27% |
58.64 |
|
| £45-50K |
1.37% |
2.48% |
55.23 |
|
| £50-55K |
1.00% |
1.90% |
52.48 |
|
| £55-60K |
0.74% |
1.47% |
50.24 |
|
| £60-65K |
0.56% |
1.15% |
48.39 |
|
| £65-70K |
0.42% |
0.91% |
46.86 |
|
| £70-75K |
0.33% |
0.72% |
45.59 |
|
| £75-80K |
0.26% |
0.57% |
44.52 |
|
| £80-85K |
0.20% |
0.46% |
43.63 |
|
| £85-90K |
0.16% |
0.37% |
42.88 |
|
| £90-95K |
0.13% |
0.31% |
42.25 |
|
| £95-100K |
0.10% |
0.25% |
41.72 |
|
| £100K + |
0.54% |
1.34% |
40.41 |
|
|
|
|


|
1992-1997
|
1997-2001
|
|
|
|
| Con |
-9.05% |
| Lab |
9.88% |
| LD |
-2.31% |
|
| Con |
-2.18% |
| Lab |
-4.10% |
| LD |
5.82% |
|
|
|
Hazel Blears
Labour hold
|
| Con |
 |
3,446 |
15.26% |
| Lab |
 |
14,649 |
64.88% |
| LD |
 |
3,637 |
16.11% |
| Oth |
 |
846 |
3.75% |
| Maj |
 |
11,012 |
48.77% |
| Turn |
|
22,578 |
100.28% |
|
|
|
Hazel Blears
Labour hold
|
| L |
Hazel Blears |
14,649 |
64.88% |
| SA |
Peter Grant |
414 |
1.83% |
| C |
Chris King |
3,446 |
15.26% |
| I |
Roy Masterson |
216 |
0.96% |
| LD |
Norman Owen |
3,637 |
16.11% |
| UK |
Hazel Wallace |
216 |
0.96% |
|
Candidates representing 6 parties stood for election to this seat.
|
|
|
Hazel Blears
Labour
|
| Con |
|
5,779 |
17.45% |
| Lab |
|
22,848 |
68.98% |
| LD |
|
3,407 |
10.29% |
| Ref |
 |
926 |
2.80% |
| Oth |
|
162 |
0.49% |
| Maj |
|
17,069 |
51.53% |
| Turn |
|
33,122 |
56.51% |
|
|
|
|
Labour
|
| Con |
|
10,545 |
26.50% |
| Lab |
|
23,532 |
59.10% |
| LD |
|
5,017 |
12.60% |
| Oth |
|
711 |
1.80% |
| Maj |
|
12,987 |
32.60% |
| Turn |
|
39,805 |
65.10% |
|
|
|
|
|