|
Scarborough & Whitby
Labour hold

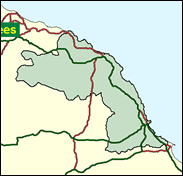
Of all the seats within which the Conservatives outvoted Labour in the 1999 European elections, the second greatest gap was recorded in Scarborough and Whitby (23.0pc). By this measure this would make the seat a most likely regain at the next general election. Corroboration is of course needed, given the particular one-off circumstances of those contests. In the 1999 Scarborough borough elections, which now look as if they took place exactly half-way through Labour's (first?) term of office, the Tory candidates were 9pc ahead of Labour's. This is a substantial margin, but not impregnable, and although John Sykes is probably the favourite to win his seat back at the next general election here in coastal North Yorkshire, Lawrie Quinn should not give up yet.

Lawrie Quinn, a pink-cheeked railwayman - latterly an engineer with Railtrack - has wisely kept his job open following his unexpected victory here in 1997, where he was washed in on Labour's high tide in the downwardly-mobile seaside towns. An engine driver's son, born in 1956 and educated at Haraby School, Carlisle and Hatfield Polytechnic, he has performed as a campaigner for local interests and a bowler of loyalist questions, and only straying latterly as a vocal critic of the proposed American National Missile Defence system. Expecting to recapture the seat he lost in 1997, is Conservative John Sykes, a right-wing Yorkshire businessman with interests in property, petrol stations, and plastics manufacture. Born 1956 and educated at Giggleswick School, he targets dole-on-sea scroungers and "dirty, lazy drop-out" New Age travellers, in a passable impression of a nineteenth century mill owner.
 |
| Wealthy Achievers, Suburban Areas |
7.34% |
14.99% |
48.95 |
|
| Affluent Greys, Rural Communities |
8.97% |
2.13% |
421.74 |
|
| Prosperous Pensioners, Retirement Areas |
8.16% |
2.49% |
328.31 |
|
| Affluent Executives, Family Areas |
0.94% |
4.43% |
21.24 |
|
| Well-Off Workers, Family Areas |
1.55% |
7.27% |
21.26 |
|
| Affluent Urbanites, Town & City Areas |
1.31% |
2.56% |
51.19 |
|
| Prosperous Professionals, Metropolitan Areas |
0.00% |
2.04% |
0.00 |
|
| Better-Off Executives, Inner City Areas |
8.67% |
3.94% |
219.96 |
|
| Comfortable Middle Agers, Mature Home Owning Areas |
22.39% |
13.04% |
171.73 |
|
| Skilled Workers, Home Owning Areas |
12.67% |
12.70% |
99.74 |
|
| New Home Owners, Mature Communities |
9.51% |
8.14% |
116.73 |
|
| White Collar Workers, Better-Off Multi Ethnic Areas |
5.12% |
4.02% |
127.36 |
|
| Older People, Less Prosperous Areas |
3.14% |
3.19% |
98.69 |
|
| Council Estate Residents, Better-Off Homes |
5.88% |
11.31% |
51.97 |
|
| Council Estate Residents, High Unemployment |
0.68% |
3.06% |
22.14 |
|
| Council Estate Residents, Greatest Hardship |
3.65% |
2.52% |
144.99 |
|
| People in Multi-Ethnic, Low-Income Areas |
0.00% |
2.10% |
0.00 |
|
| Unclassified |
0.02% |
0.06% |
27.92 |
|
|
 |
 |
 |
| £0-5K |
11.67% |
9.41% |
124.02 |
|
| £5-10K |
20.10% |
16.63% |
120.87 |
|
| £10-15K |
19.07% |
16.58% |
115.05 |
|
| £15-20K |
14.58% |
13.58% |
107.32 |
|
| £20-25K |
10.30% |
10.39% |
99.10 |
|
| £25-30K |
7.09% |
7.77% |
91.20 |
|
| £30-35K |
4.86% |
5.79% |
83.99 |
|
| £35-40K |
3.36% |
4.33% |
77.56 |
|
| £40-45K |
2.35% |
3.27% |
71.90 |
|
| £45-50K |
1.66% |
2.48% |
66.94 |
|
| £50-55K |
1.19% |
1.90% |
62.60 |
|
| £55-60K |
0.87% |
1.47% |
58.79 |
|
| £60-65K |
0.64% |
1.15% |
55.43 |
|
| £65-70K |
0.48% |
0.91% |
52.47 |
|
| £70-75K |
0.36% |
0.72% |
49.84 |
|
| £75-80K |
0.27% |
0.57% |
47.50 |
|
| £80-85K |
0.21% |
0.46% |
45.41 |
|
| £85-90K |
0.16% |
0.37% |
43.52 |
|
| £90-95K |
0.13% |
0.31% |
41.83 |
|
| £95-100K |
0.10% |
0.25% |
40.29 |
|
| £100K + |
0.45% |
1.34% |
33.49 |
|
|
|

|


|
1992-1997
|
1997-2001
|
|
|
|
| Con |
-13.59% |
| Lab |
15.74% |
| LD |
-4.78% |
|
| Con |
3.44% |
| Lab |
1.55% |
| LD |
-5.75% |
|
|
 |
Lawrie Quinn
Labour hold
|
| Con |
 |
18,841 |
39.65% |
| Lab |
 |
22,426 |
47.19% |
| LD |
 |
3,977 |
8.37% |
| Oth |
 |
2,279 |
4.80% |
| Maj |
 |
3,585 |
7.54% |
| Turn |
 |
47,523 |
63.18% |
|
|
 |
Lawrie Quinn
Labour hold
|
| G |
Jonathan Dixon |
1,049 |
2.21% |
| UK |
John Jacob |
970 |
2.04% |
| P |
Theresa Murray |
260 |
0.55% |
| LD |
Tom Pearce |
3,977 |
8.37% |
| L |
Lawrie Quinn |
22,426 |
47.19% |
| C |
John Sykes |
18,841 |
39.65% |
|
Candidates representing 6 parties stood for election to this seat.
|
|
 |
Lawrence Quinn
Labour gain
|
| Con |
 |
19,667 |
36.21% |
| Lab |
 |
24,791 |
45.64% |
| LD |
 |
7,672 |
14.12% |
| Ref |
 |
2,191 |
4.03% |
| Oth |
|
0 |
0.00% |
| Maj |
 |
5,124 |
9.43% |
| Turn |
 |
54,321 |
71.61% |
|
|
 |
|
Conservative
|
| Con |
 |
29,334 |
49.80% |
| Lab |
 |
17,600 |
29.90% |
| LD |
 |
11,133 |
18.90% |
| Oth |
 |
876 |
1.50% |
| Maj |
 |
11,734 |
19.90% |
| Turn |
 |
58,943 |
77.28% |
|
|
 |
|

|

